


Under salt-alkali stress, what wheat seedlings first lose is not necessarily “total water,” but rather the activity space and distribution order of water inside and outside cells. Gu et al. combined low-field NMR relaxation spectroscopy with proton density-weighted imaging (PDWI) to address two questions simultaneously: from which state does water transition? And how does it become heterogeneous in tissue space? The study compared different stress levels over 12 to 72 h under controlled culture conditions and fed the two types of signals into different fusion models.
Core Findings of the Study
The research material was the salt-tolerant variety Dekang961 wheat seedlings. 1D T₂ and 2D T₁–T₂ relaxation were used to read water molecular mobility and microenvironment, while PDWI and its gray-level co-occurrence matrix (GLCM) texture were used to describe water spatial distribution. At the 72 h endpoint, stomatal width and MDA were also measured as destructive physiological validation.
Results showed that with increasing stress, free water A₂₃ relatively decreased, while bound water A₂₁ and semi-bound water A₂₂ relatively increased; the continuous high-signal band in PDWI gradually fragmented into discrete spots, with contrast, dissimilarity, and entropy increasing. The DTLFSEResNet, which encodes the two types of information in separate towers and fuses them at a high-level semantic stage, achieved 95.93% accuracy in the study’s independent test set, higher than models using T₂ or PDWI alone.
First, What Exactly Did This Study Measure?
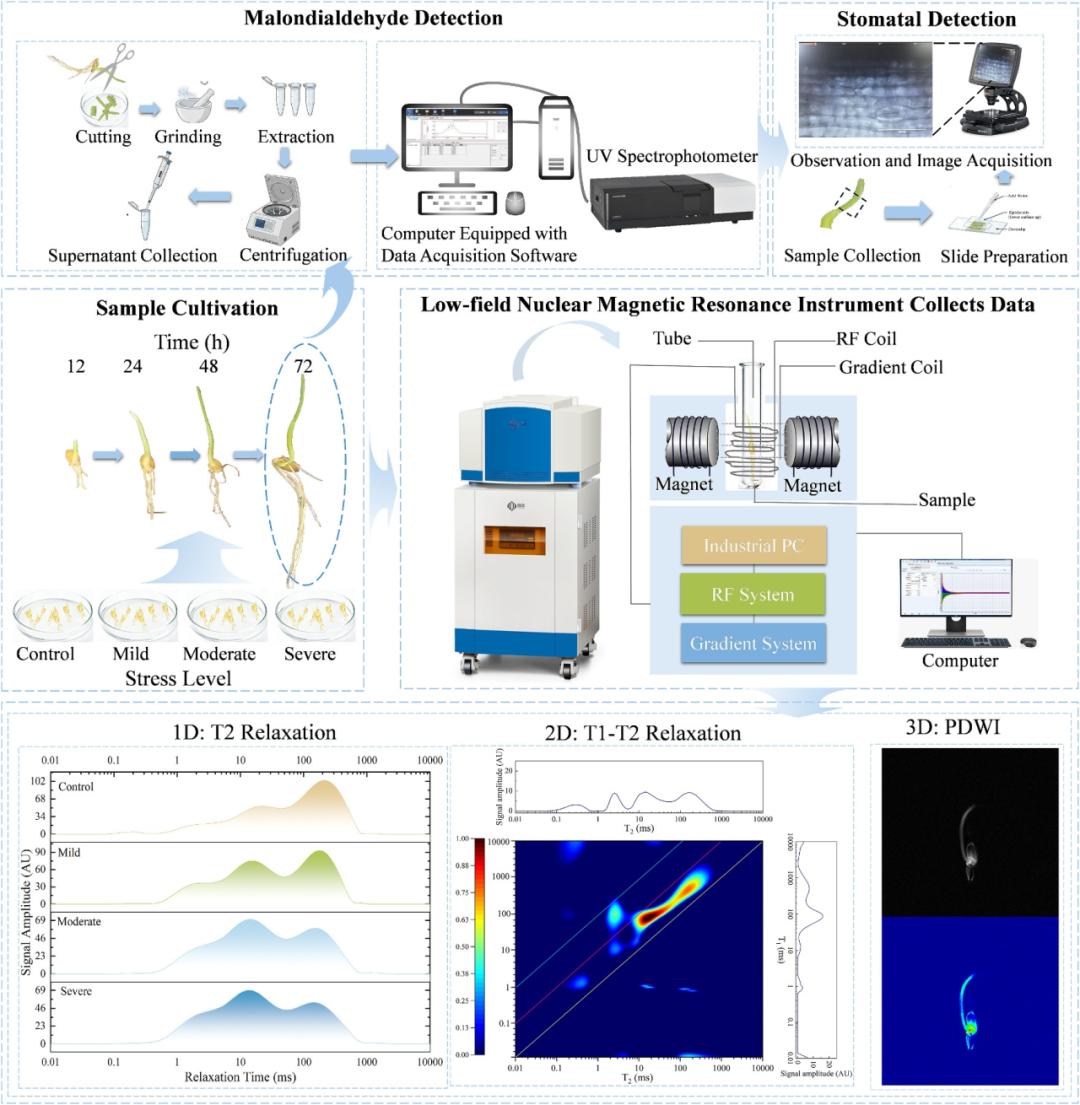
Fig. 1. Wheat seedling cultivation and 1D T₂, 2D T₁–T₂, and PDWI acquisition workflow
NMR and imaging readouts at 12, 24, 48, and 72 h came from non-destructive acquisition, thus tracking changes within the same culture window. Stomatal width and MDA were measured only at 72 h, indicating they are endpoint consistency evidence, not one-to-one validation corresponding to each early time point. This distinction determines that the paper can support “signals are consistent with endpoint physiological status,” but cannot directly write each early spectral change as a causally verified physiological event.
Water Does Not Simply Decrease—It Changes Its Activity State
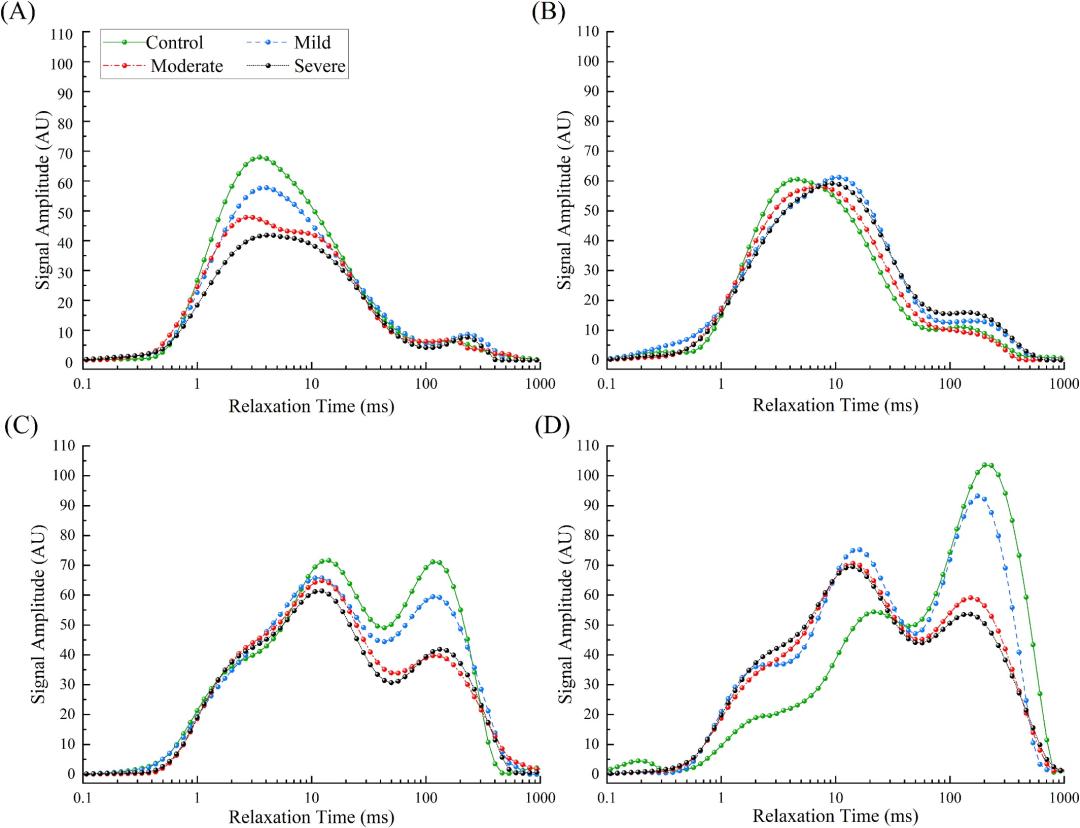
Fig. 3. Dynamic changes in T₂ relaxation spectra of wheat seedlings under different salt-alkali stress levels
T₂ spectra divide water into bound water, semi-bound water, and free water based on relaxation time. At 72 h, the proportion of A₂₃ under control, mild, moderate, and severe stress was 53.96%, 31.87%, 13.69%, and 11.43%, respectively. This dataset supports that the free water proportion decreases with increasing stress, and the degree of water motion restriction increases. The 2D T₁–T₂ map further shows the main peak shifting toward shorter time regions, with a more prominent restricted water population appearing under moderate to severe stress.
It should be avoided to directly equate peak area proportions with the true water volume of a specific cellular compartment. Low-field NMR readouts reflect the combined changes in water molecular mobility and surrounding microenvironment, and are more suitable as rapid, non-destructive indicators of water state phenotype. Based solely on 1D T₂ patterns, adjacent stress levels still partially overlap, which is also the reason the paper introduced the imaging modality.
Imaging Adds the Spatial Dimension
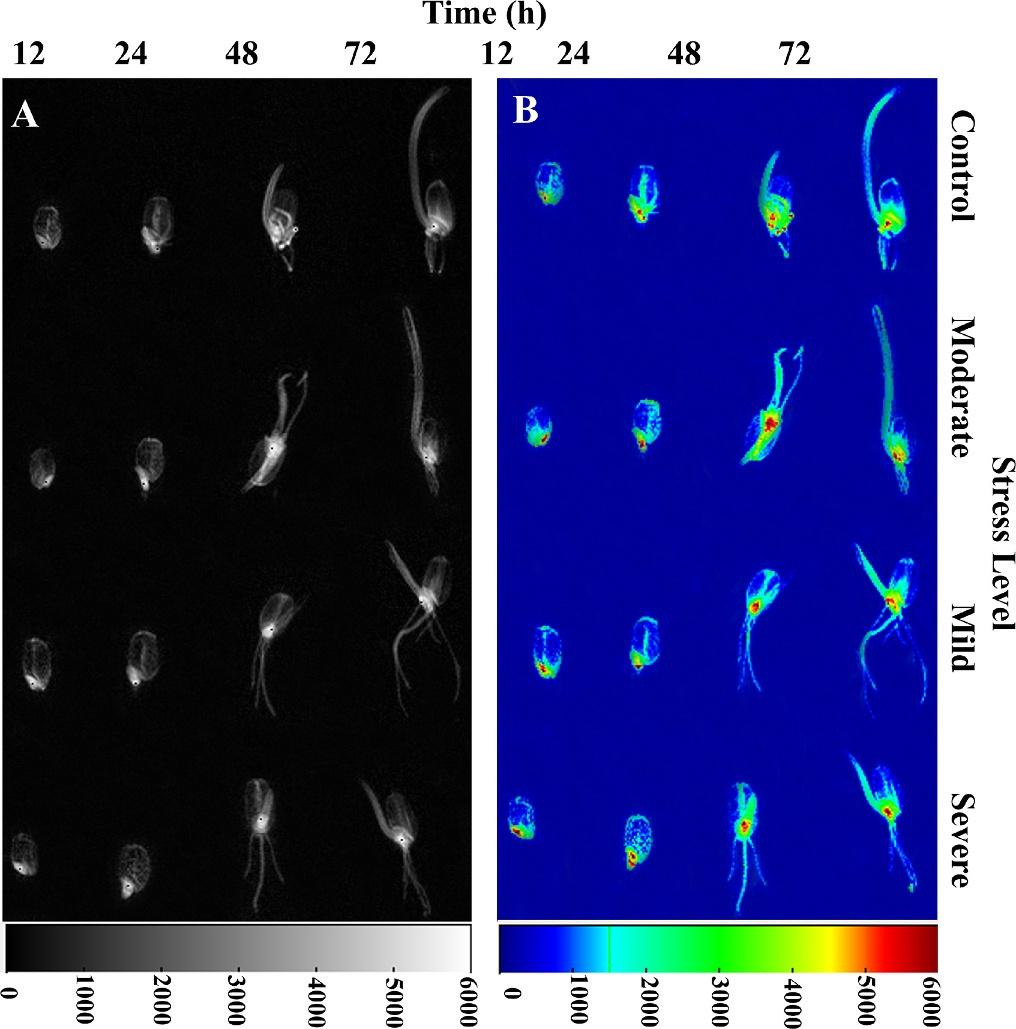
Fig. 5. Proton density-weighted images of wheat seedlings under different stress levels. A: grayscale; B: pseudo-color
In the control group, high-signal regions were more continuous; under moderate to severe stress, grayscale decreased and high signals gradually fragmented. Texture calculation converted this visual impression into indicators: contrast, dissimilarity, and entropy increased, while homogeneity, energy, and correlation decreased. Together, they point to increased heterogeneity in water spatial distribution.
This does not mean a single image can directly determine membrane rupture or ion toxicity. The paper selected the middle 2D slice from each 3D image and extracted 24 GLCM features in four directions. This design preserves spatial structural differences, but further validation is still needed for the whole-plant 3D state and real field background. At 72 h, stomatal width decreased from 13.80 μm in the control to 7.42 μm under severe stress, and MDA increased from 38.80 to 77.33 nmol/gFW, consistent with the overall trends of imaging and relaxation signals.
Why Does Late Fusion Perform Better?
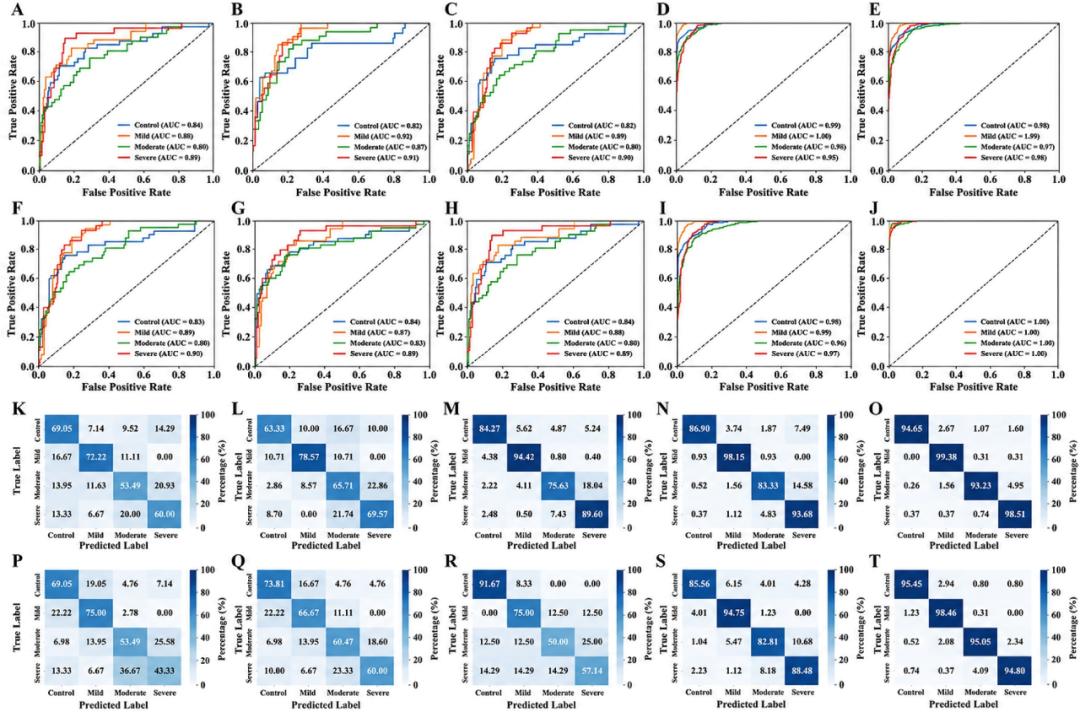
Fig. 7. ROC curves and confusion matrices of different models on training and test sets
Early fusion, which directly concatenates heterogeneous features at the input end, achieved a test accuracy of 71.43%; intermediate fusion achieved 87.56%; dual-tower late fusion reached 95.93%. Single-modality T₂ and PDWI models achieved 60.93% and 65.56%, respectively. The difference indicates that multimodal does not simply mean more data is better; the location of fusion determines whether the model can preserve the meaning of each signal.
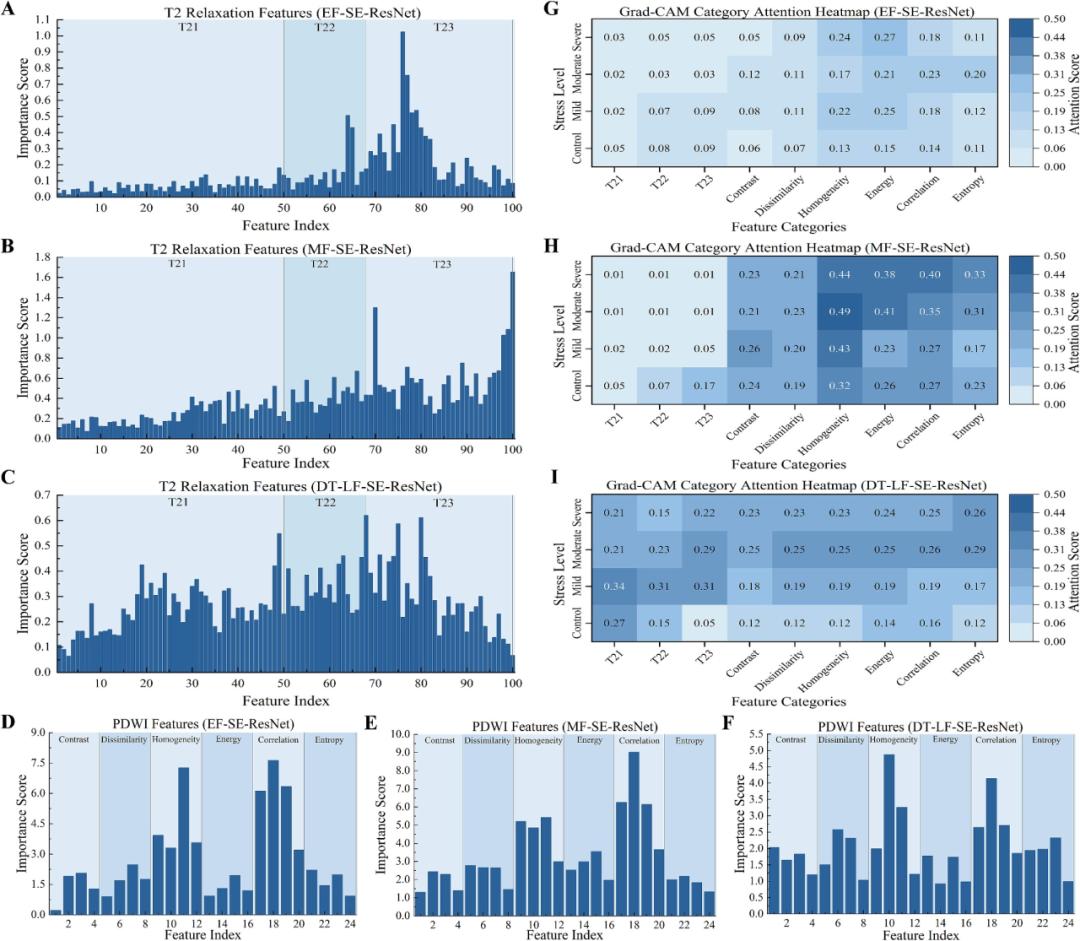
Fig. 8. Feature importance and GradCAM attention visualization for different fusion strategies. Source: Gu et al., 2026, DOI: 10.1016/j.compag.2026.112014
The dual-tower model simultaneously focuses on T₂₁, T₂₂, T₂₃ and PDWI features such as homogeneity, correlation, and contrast. It can be understood as: relaxation spectra provide water state changes, imaging texture provides spatial structural changes, and both participate in classification at a high level. The interpretability here means that model decisions are linked to measurable features, which does not equal having proven a complete physiological causal pathway.
What Value Does This Work Have for Agricultural Phenotyping Research?
The most valuable part of the paper is not providing a directly deployable salt-alkali stress threshold, but demonstrating a reusable problem framework: use one modality to observe water state, another to observe spatial organization, and then let the model fuse them while preserving their respective semantics. For variety screening, controlled stress experiments, and mechanistic research, this combination can advance traditional endpoint detection into dynamic, non-destructive process phenotyping.
The study only covered a single variety, early seedling stage, 12 to 72 h, and idealized culture conditions; the stability of the model under repeated random splits cannot replace cross-variety, cross-growth-stage, cross-soil-condition, or field external validation. Only by incorporating more genotypes, environmental factors, and time-matched physiological indicators in the future can the generalization range of this framework in complex agricultural scenarios be determined.
Conclusion
Salt-alkali stress changes not only how much water wheat seedlings have, but also what state the water is in, whether its distribution is continuous, and whether the tissue microenvironment becomes more heterogeneous. The combination of low-field NMR relaxation and PDWI provides complementary readouts for these two layers of information; dual-tower late fusion translates this complementarity into better classification performance within the research dataset.
For future applications, the key is not to directly adopt the number 95.93%, but to continue validating whether this evidence chain of water state plus spatial heterogeneity can cross varieties, environments, and growth stages.
Original Article
Gu, Y.; Feng, G.; Zhou, Y.; Zhang, H.; Wang, C.; Chen, L.; Luo, B. Multimodal deep fusion of Low Field NMR and proton Density Weighted imaging for interpretable detection of Saline Alkali stress in wheat. Computers and Electronics in Agriculture, 251 (2026), 112014. DOI: 10.1016/j.compag.2026.112014.
 Scan QR Code
 Scan QR Code
 Phone Support
Phone: 400-060-3233
After-sales: 400-060-3233
 WeChat Support

 Official Account

Back to Top