


Can a Beam of Light Rewrite the Flavor Trajectory of a Bottle of Oil?
Transparent packaging, retail lighting, and laboratory exposure all bring edible oils into contact with light. The photostability of oils is reflected not only in changes in oxidation indicators but also in whether flavor compounds evolve along new chemical pathways. Pyrazines are often associated with nutty and roasted odors; at appropriate levels they contribute pleasant flavors, while in excess they can lead to burnt or scorched defects.
Weng et al. used first-grade refined soybean oil as a model, employing two-dimensional low-field nuclear magnetic resonance (2D LF-NMR) relaxation fingerprinting to track changes related to 2-methylpyrazine (2-MPZ) under full-spectrum illumination, with cross-validation by high-field ¹H NMR. Below, we review the experimental observations, strength of evidence, technical value of the 2D fingerprint, and remaining questions, following the original figures and tables.
Under specific conditions—300 W xenon lamp, sample distance of 12 cm from the light source, 0–60 min irradiation, and NMR testing at 32 °C—the research team observed new high-field ¹H NMR signals in the 8.3–8.8 ppm region in soybean oil. Meanwhile, the A, B, and C characteristic regions of the 2D low-field relaxation difference spectra showed time-dependent increases. Standard addition experiments established a correspondence between these high-field signals and 2-MPZ.
This is not a real shelf-life simulation: short-distance xenon lamp irradiation represents accelerated photo-stress. Nor is it a compound structure identification based solely on the 2D fingerprint: the 2D low-field readout reflects changes in relaxation patterns, while the assignment of 2-MPZ relies mainly on high-field spectra and standard addition anchoring. It is within these boundaries that the paper demonstrates methodological significance.
Traditional HS-SPME-GC-MS or GC-MS/MS are excellent for identification and quantification of volatile flavor compounds, but they require sample pretreatment, optimization of extraction conditions, and relatively long analytical workflows. High-field ¹H NMR can provide chemical shift and structural information; in this study, it was used to confirm the differences in the 8.3–8.8 ppm region before and after illumination.
2D low-field NMR takes a different route: it does not resolve fine chemical shifts but instead encodes molecular mobility and local microenvironmental changes across multiple relaxation dimensions into a fingerprint map.
The team placed 3 mL oil samples in sealed glass tubes and exposed them to a 300 W xenon lamp at a vertical distance of 12 cm, with irradiation gradients of 0, 15, 30, 45, and 60 min. To reduce interference from light-induced temperature fluctuations on relaxation rates, samples were transferred to a 32 °C temperature control unit and equilibrated for 15 min before testing. 2D LF-NMR measurements were performed using a Suzhou Niumag PQ001-20-020V benchtop system (0.50 ± 0.05 T, ¹H 21.0 MHz), with D3 optimized to 100 ms.
Two design points are often overlooked. First, the 2D difference spectra use untreated or zero-concentration samples as background, calculating differences for each relaxation coordinate: green indicates near-zero difference, warm colors indicate signal enhancement, and cool colors indicate attenuation. Second, the so-called “quasi-in-situ” refers to rapid transfer and constant-temperature testing after illumination, rather than continuous real-time acquisition by the probe inside the illumination chamber. The two cannot be confused.
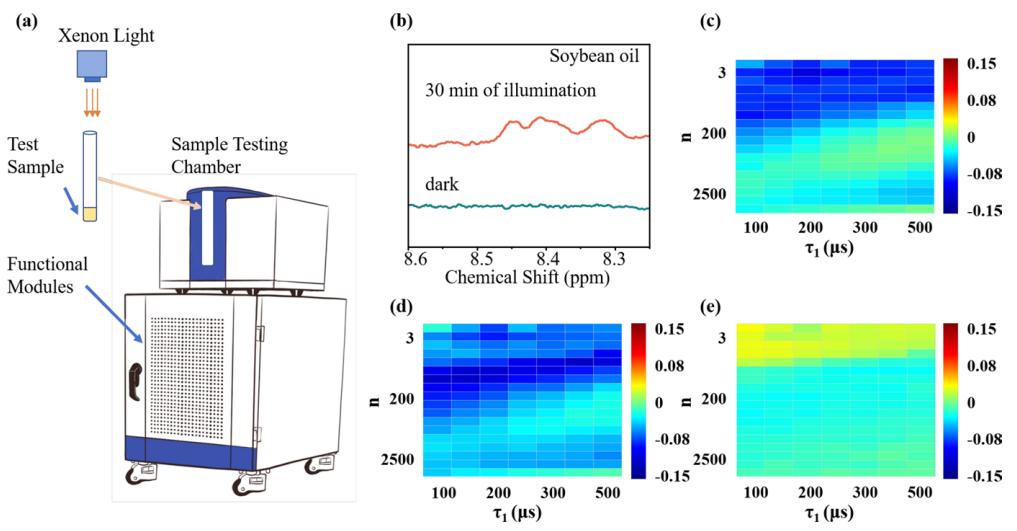
Figure 1 | Original Fig. 1 (a–e). (a) Illumination and NMR acquisition workflow; (b) High-field ¹H NMR of soybean oil before and after 30 min illumination; (c–e) 2D relaxation difference spectra before and after illumination. Key reading points: new peak regions appear in high-field spectra, while 2D difference spectra highlight local changes within the overall oil background.
The evidence chain in Figure 1 is clear: Figure 1b shows that after 30 min full-spectrum illumination, soybean oil exhibits new resonance signals at approximately 8.3–8.6 ppm; Figure 1e shows that relative to the unirradiated background, the main peak region of the 2D fingerprint exhibits positive changes. The supported conclusion is: under these experimental conditions, illumination is accompanied by 2-MPZ-related high-field responses and changes in 2D relaxation patterns. The conclusion that cannot be directly drawn is: every warm-colored pixel in the 2D map is solely contributed by 2-MPZ.
Fig. 2 is the most important methodological bridge in the paper. In high-field spectra of soybean oil illuminated for 120 min and a 200 μM 2-MPZ standard, the characteristic peak positions are close; further, in addition gradients of 40, 80, 120, and 160 μM, the high-field characteristic peak integral shows a linear relationship with concentration, with reported R² = 0.99. Thus, high-field NMR provides a strong anchor for “this peak region is related to 2-MPZ.”
On the low-field side, using pure soybean oil as background, under 200, 400, 600, and 800 μM 2-MPZ addition, A, B, and C regions showed difference spectra changes from weak to strong, and these region integrals were mapped into a 3D feature space. This should be accurately understood as “the 2D characteristic regions have a usable correlation with standard addition concentration,” rather than low-field NMR directly providing molecular structure information of 2-MPZ. To establish a generalizable quantitative method, detection limits, repeatability, recovery, matrix interference, external validation sets, and GC-MS comparison are still needed.
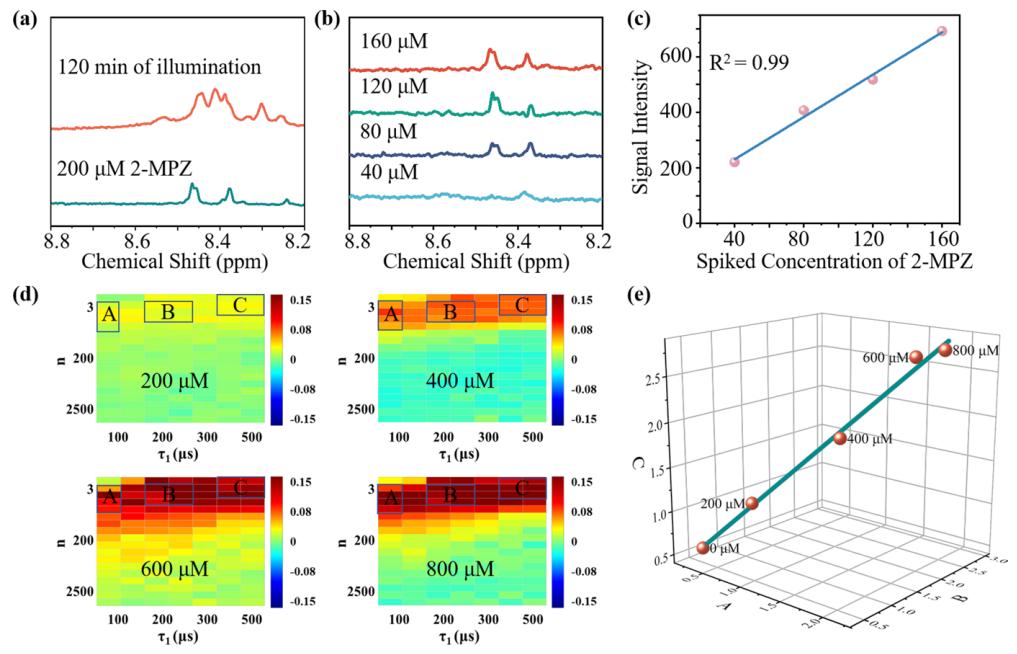
Figure 2 | Original Fig. 2 (a–e). High-field ¹H NMR standard addition response (a–c) and 2D LF-NMR A/B/C characteristic region concentration gradient response (d–e). Key reading points: high-field spectra serve as “compound-related anchors,” while 2D fingerprints serve as “correlation pattern readouts.”
Fig. 3 uses 0 min soybean oil as reference and shows 2D difference spectra at 15, 30, 45, and 60 min.
Regions A, B, and C gradually evolve from light green to warm colors, indicating signal enhancement relative to background; under the same time gradient, the 8.3–8.7 ppm region of high-field ¹H NMR also gradually increases. The two readout directions are consistent, which is the core evidence that the 2D fingerprint can be used for dynamic tracking.
The A, B, and C region signals were used to predict the high-field 2-MPZ peak area, with PLSR reporting R² = 0.986, RMSEP = 39.127, and showing Region C (VIP 1.152) higher than B (1.087) and A (1.023). Because the sample size is only n = 5 and LOOCV was used, there is still a risk of overfitting. Therefore, a more prudent statement is: the results demonstrate the potential for building a predictive model, rather than a already deployable quantitative model.
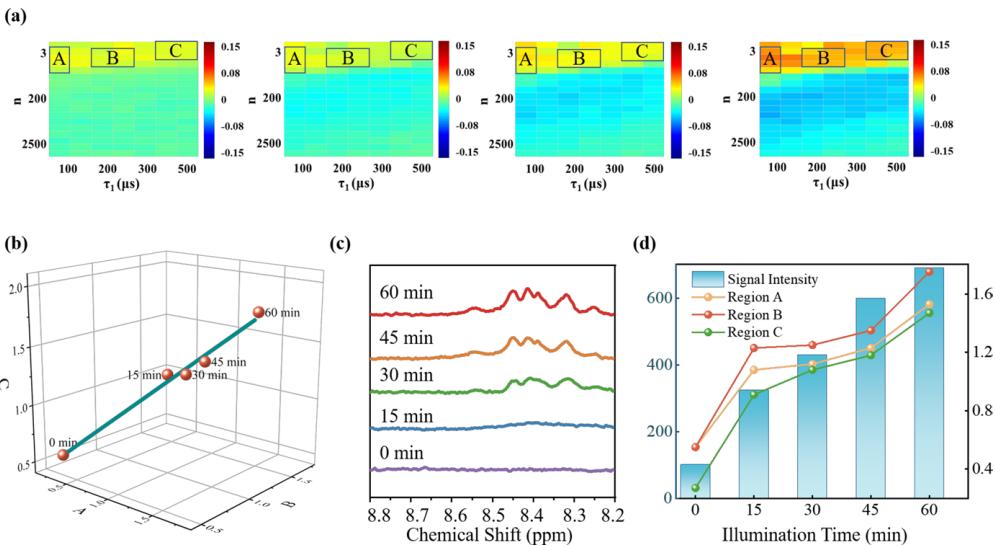
Figure 3 | Original Fig. 3 (a–d). 2D difference spectra, 3D feature trajectory, high-field spectra, and signal correlation for 15–60 min illumination. Key reading points: 2D A/B/C features and high-field peak regions show consistent time evolution, but PLSR is based on only 5 time points and should be regarded as proof of concept.
Fig. 4 advances the question from “whether it forms” to “under what conditions it forms.” After 30 min full-spectrum illumination of olive oil, no corresponding new peaks appeared at 8.3–8.8 ppm, and its 2D difference spectrum differed from the positive enhancement of soybean oil. The paper links the difference to antioxidant components such as polyphenols and vitamin E in olive oil, as well as its higher proportion of monounsaturated fatty acids; this is a chemically plausible explanation, but a single component or single fatty acid indicator cannot yet be regarded as the sole causal variable.
In wavelength control experiments, the results showed that soybean oil exhibited the clearest response under broad-spectrum illumination (BSI); 380 nm monochromatic light produced only marginal, isolated signals; 450 and 550 nm showed no detectable product-related signals, and supplementary experiments at 650 and 700 nm were also negative. This phenomenon supports wavelength dependence and an energy threshold for the reaction; however, “multispectral coupling is key” remains a mechanistic inference. To elevate this inference to a conclusion, irradiance, photon flux, and isodose comparisons at each wavelength need to be reported.
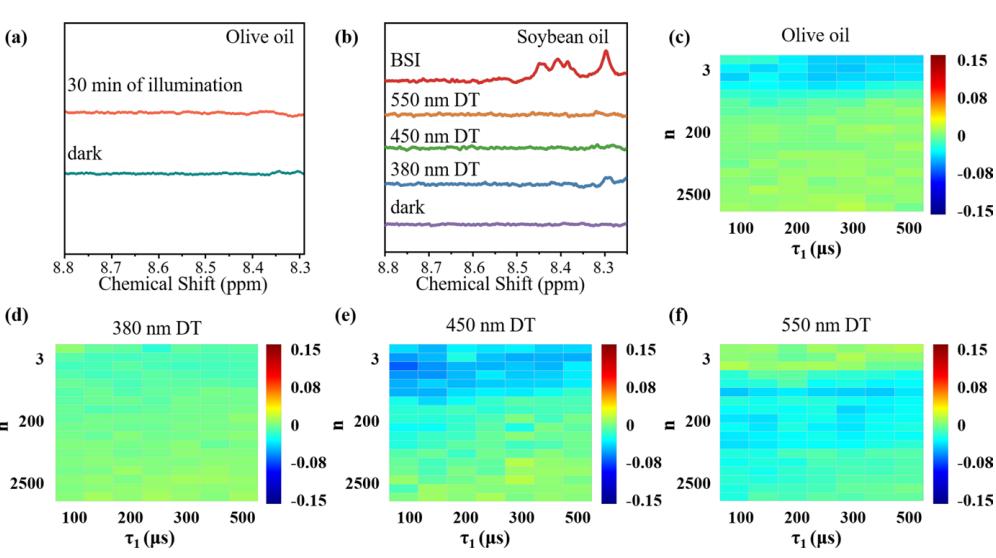
Figure 4 | Original Fig. 4 (a–f). High-field spectra comparison of olive oil and soybean oil, and 2D difference spectra under full-spectrum/380, 450, 550 nm monochromatic light. Key reading points: oil matrix and spectral conditions jointly affect the response; “broad-spectrum coupling” is explanatory but still requires standardized light-dose experiments for verification.
The core value of this work is not to replace all flavor analysis methods with 2D low-field NMR, but to provide a 2D time-domain observation window that requires no pretreatment and can rapidly track microscopic changes in oils under photo-stress. 2D LF-NMR is suitable for stress comparison, batch screening, formulation or packaging scheme comparison, and front-end observation in mechanistic research.
The need for restraint is equally important.
First, 2D relaxation fingerprints are sensitive to local changes, which does not equal absolute specificity for the target compound; they should form an evidence chain together with high-field NMR, GC-MS, oxidation indicators, or sensory results.
Second, the “green” aspect of the paper mainly refers to eliminating complex pretreatment and organic solvents; instrument time, modeling, and cross-matrix validation remain part of the method cost.
Third, the risk warning for transparent packaging and broad-spectrum exposure has practical significance, but a commercial packaging light-protection duration threshold cannot be directly derived from it.
Conclusion
The inspiration of this paper is not to replace all mature flavor analysis techniques with low-field NMR, but to open a new perspective: when oils are exposed to photo-stress, can 2D time-domain signals without pretreatment be used to observe microscopic changes earlier and more systematically? Weng et al. provide a strong proof of concept. If future work can supplement evidence with standardized light doses, GC-MS quantification, multi-batch blind samples, and real shelf-life tests, 2D LF-NMR may grow from a “sensitive fingerprint tool” into a reliable module in oil flavor stability research and quality control.
Original Article
Weng, Y.; Pang, J.; Shi, Y.; et al. Development of 2D LF-NMR relaxation fingerprinting for pyrazine detection and its application in monitoring photo-induced formation in soybean oil. Research on Chemical Intermediates, 2026, 52, 5089–5104. DOI: 10.1007/s11164-026-05980-7.
 Scan QR Code
 Scan QR Code
 Phone Support
Phone: 400-060-3233
After-sales: 400-060-3233
 WeChat Support

 Official Account

Back to Top