
With the global development of shale reservoirs, exploring gas transport mechanisms has become a focal point for researchers in the oil and gas industry.
Shale reservoirs have the ability to store and transport hydrocarbons, and the characteristics of their pore-fracture systems—such as pore size distribution (PSD), morphology, geometry, and connectivity—directly influence the production of commercial shale gas.
Therefore, accurately and efficiently characterizing the full-scale pore size distribution of shale reservoirs and exploring the gas transport mechanisms in the reservoirs are critical tasks.
So far, many scholars have published numerous papers and used various methods to explore the PSD characterization of shale samples, such as low-temperature gas adsorption (LTGA), mercury intrusion porosimetry (MIP), and nuclear magnetic resonance (NMR).
As shale reservoirs are being developed worldwide, exploring gas transport mechanisms has become a primary focus for researchers in the oil and gas industry.
Shale reservoirs are capable of storing and transporting hydrocarbons, and the characteristics of their pore-fracture systems, such as pore size distribution (PSD), morphology, geometry, and connectivity, directly affect the production of commercial shale gas.
Hence, accurately and efficiently characterizing the full-scale pore size distribution of shale reservoirs and studying the gas transport mechanisms in these reservoirs is a crucial undertaking.
Many scholars have published numerous articles to explore the PSD characterization of shale samples using various methods, such as low-temperature gas adsorption (LTGA), mercury intrusion porosimetry (MIP), and nuclear magnetic resonance (NMR).

Figure 1 Common Techniques and Their Target Size Ranges
Currently, most scholars classify shale pores based on the following criteria: micropores (<2 nm), mesopores (2-50 nm), and macropores (>50 nm). This classification, based on physical adsorption theory, focuses more on the nanoscale (especially <100 nm), which may not be suitable for the unique pore-fracture systems of shale.
Furthermore, some previous classification studies were based on image analysis of pore morphology, geometry, and geological (mineral composition and distribution) characteristics, rather than focusing on pore size distribution. Such classifications often fail to consider the complex gas transport mechanisms in shale and overlook the connection between specific pore sizes and different gas transport mechanisms.

In this study, the shale pore-fracture system and its related gas transport mechanisms were systematically investigated.
Firstly, PSD measurements were taken for six shale samples using LTGA, MIP, and NMR. Then, FE-SEM and CT image analysis techniques were used to observe the internal structures of these shale samples.
Subsequently, the PSD results from different methods were compared, providing a comprehensive characterization of the shale pore-fracture system.
Finally, a new pore size classification standard based on gas transport mechanisms in shale was proposed.
This multi-scale characterization of the shale pore-fracture system and the pore size classification method considering gas transport mechanisms provide significant insights for guiding the commercialization of shale gas development.
Experimental Samples and Physical Properties:
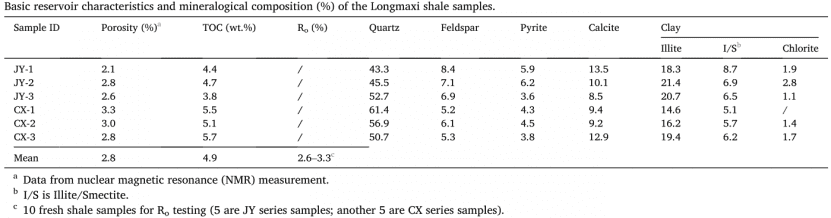
Six shale samples were collected from the target formation. Various methods and instruments, such as infrared (NDIR) detection, TOC-L analysis, X-ray diffraction (XRD), and automatic digital rock phase analysis instruments, were used to investigate their rock physical characteristics and mineral composition. The results are as follows:
Table 1 Basic Reservoir Characteristics and Mineral Composition of Shale Samples
To further investigate the shale pore-fracture system and its related gas transport mechanisms, several experimental methods were employed at different scales, including nitrogen low-temperature gas adsorption (LTGA), mercury intrusion porosimetry (MIP), and nuclear magnetic resonance (NMR) to describe the shale pore size distribution, and field emission scanning electron microscopy (FE-SEM) and X-ray computed tomography (CT) to describe the shale structure. The following is a detailed description of the three methods for measuring pore size distribution.
The shale samples were crushed into powders (particle size <150μm) for LTGA analysis.
Before analysis, the samples must be heated and placed in a vacuum environment (also known as sample degassing) to remove moisture and other contaminants, as most solid materials absorb moisture and other pollutants when exposed to the atmosphere.
Therefore, all tested shale samples were automatically degassed at 110°C for 12 hours. Nitrogen was selected as the adsorbent, and the adsorption temperature was set at -196°C (77.15 K).
Finally, the PSD data of the tested samples were calculated using the BJH and DFT models.
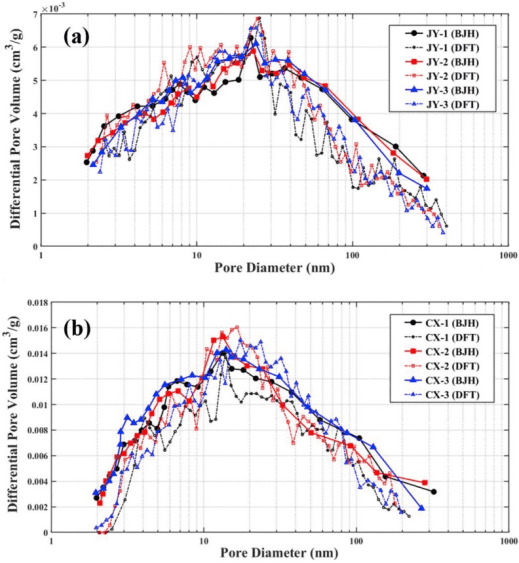
Figure 2 Pore Size Distribution from LTGA: (a) JY Series Samples; (b) CX Series Samples.
According to the LTGA results, most of the shale pores range from 5 to 200 nm, with the CX series samples containing more micropores than the JY series samples. Although the BJH model and the DFT model show generally consistent PSD results, subtle differences exist between them. The PSD curve generated by the DFT model displays multiple peaks, providing more detailed information than the BJH model.
Similar to LTGA analysis, the shale samples were crushed (particle size: <5 mm) and then baked at 110°C until their weight stabilized to remove moisture or residual hydrocarbons. The PSD data were calculated using the Washburn equation.
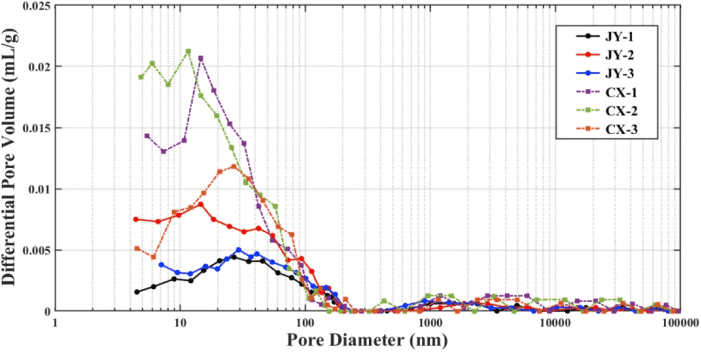
Figure 3 Pore Size Distribution from MIP
As shown in the figure, shale pore sizes range from 5 nm to 100 nm. The smaller portion (<300 nm) represents the nanopore system, while the larger portion (>1000 nm) represents the pore-microcrack system. None of the PSD data shows resolution below 5 nm, as MIP may not penetrate smaller pores due to insufficient intrusion pressure, meaning mercury cannot enter some micropores.
Compared with LTGA analysis, only half of the tested samples (JY-1, JY-3, and CX-3) showed acceptable results, while the other three samples (JY-2, CX-1, and CX-2) exhibited significantly larger pore volumes at pore sizes <300 nm compared to LTGA results. This phenomenon may be due to extreme mercury intrusion pressure causing distortion and damage to small pores.
Recent developments in nuclear magnetic resonance (NMR) have led to a surge in PSD-related studies, as the advantages of NMR technology lie in its non-invasive and non-destructive nature.
The low-field NMR equipment used was the MacroMR12-150H (Suzhou Niumai Analytical Instrument Co., Ltd.), with the following test conditions: temperature: 32°C; magnetic field strength: 0.3±0.05T; echo time (TE): 0.2 ms; waiting time (TW): 2 s; number of echoes: 10,000; scan times: 64. Cylindrical core samples (height: 100 mm, diameter: 50 mm) were evacuated and saturated with water for 24 hours before measurement. The CPMG pulse sequence was used to measure and obtain the T2 spectrum to characterize the PSD characteristics of the test samples:
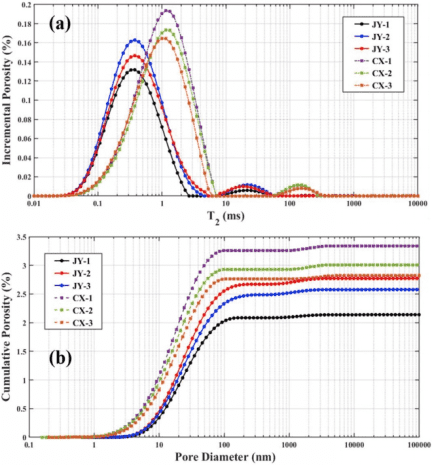
Figure 4 NMR Test Results: (a) Raw NMR T2 Spectrum of Shale Samples; (b) Relationship between Cumulative Porosity and Pore Diameter Measured by NMR.
It can be seen that the T2 spectra of each series sample are similar. In other words, the impact of sample heterogeneity can be ignored in this study. By comparing the results from LTGA and MIP, the T2 spectra were converted to pore size distributions, and the relationship between cumulative porosity and pore diameter is plotted in the figure. When pore size <300 nm, cumulative porosity increases sharply; when pore size >1000 nm, cumulative porosity increases slightly, reflecting that nanopores are the main component of the pore structure. It was also found that CX series samples contain more micropores than JY series samples.
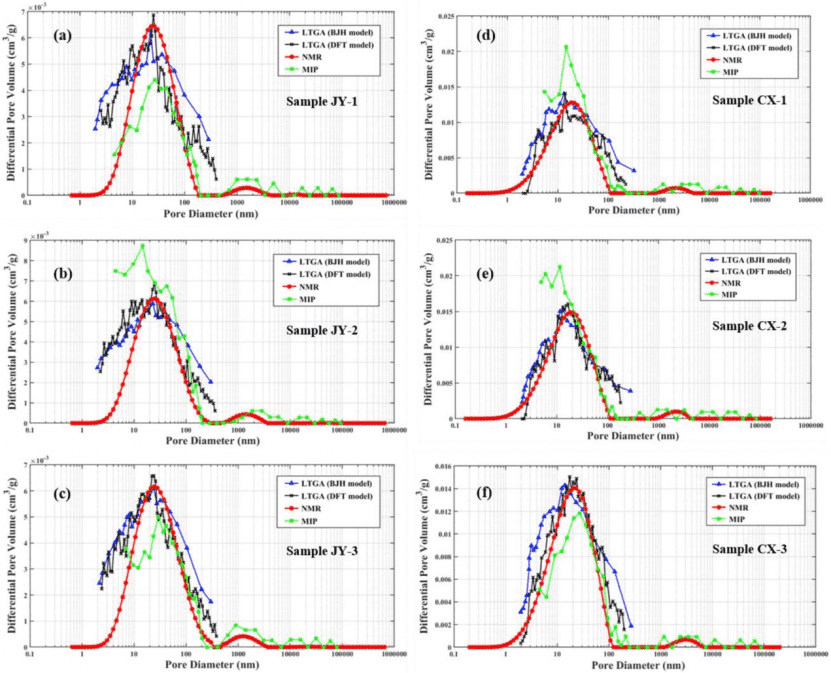
Figure 5 Comparison of PSD Measurement Results from Three Methods
A comprehensive PSD is of utmost importance for gas transport and storage in shale reservoirs, and it can serve as a fundamental basis for new pore size classification.
To convert NMR T2 spectral information into PSD, accurate and reliable surface relaxation rate values (ρ2) are required to prevent significant errors in the pore size distribution obtained by NMR. This study recommends combining NMR with at least one auxiliary method (such as LTGA or MIP) to accurately determine the surface relaxation rate values.
By comparing the NMR T2 spectra with the results from LTGA and MIP, this study determined the surface relaxation rate for JY series samples to be 16.25 nm/ms and for CX series samples to be 4 nm/ms.
After comparing the three methods, it is concluded that NMR, given the known surface relaxation rate, can accurately reveal the full-scale PSD characteristics of shale.
Gas transport in shale is widely known to occur as a non-Darcy phenomenon in shale reservoirs, referred to as the gas slip effect. Gas molecules colliding with the rock wall dominate in nanopores, enhancing gas transport and permeability.
The pore size classification of shale and its associated gas transport mechanisms are shown in Figure 6 (with NMR-based PSD results plotted as it can reveal the full-scale PSD of shale). This classification method, based on gas transport mechanisms, more effectively captures the multi-scale characteristics of shale pore-fracture systems, and the results are consistent with those based on numerical simulation works (Figure 6b: Lattice Boltzmann Method, LBM).
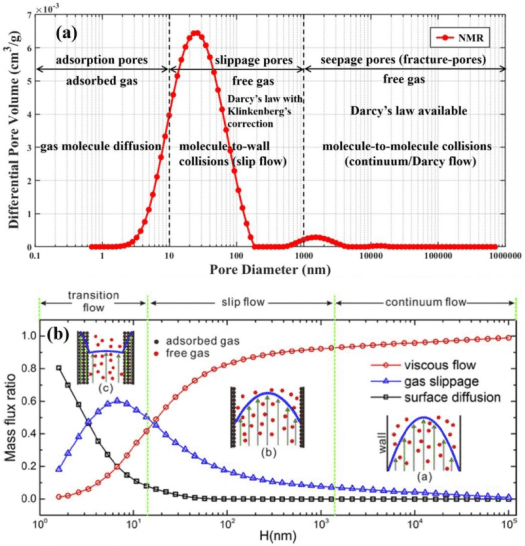
Figure 6 Shale Pore Size Classification and Its Associated Gas Transport Mechanisms (Sample JY-1 as an example); (b) Flux Contributions from Different Transport Mechanisms in Shale
Based on the full-scale PSD features and geological control discussed in this study, the shale pore sizes in terms of gas transport mechanisms can be classified into: adsorptive pores (pore size <10 nm), slip pores (10 nm < pore size < 1000 nm), and flow pores or fracture pores (pore size >1000 nm).
It can be seen that, while adsorptive pores significantly contribute to the total pore volume in shale, slip pores dominate the overall volume. However, gas transport in shale is mainly controlled by flow pores (fracture-pore systems), despite their small volume. Interestingly, as pressure continues to rise, the gas slip effect primarily in the slip pores becomes increasingly significant. The classification work in this paper provides new insights into the internal pore structure of shale and a deeper study of the complex gas transport mechanisms in shale reservoirs.
[1] Chen Y, Jiang C, Leung J Y, et al. Multiscale characterization of shale pore-fracture system: Geological controls on gas transport and pore size classification in shale reservoirs[J]. Journal of Petroleum Science and Engineering, 2021, 202:108442.
[1] Chen Y, Jiang C, Leung J Y, et al. Multiscale characterization of shale pore-fracture system: Geological controls on gas transport and pore size classification in shale reservoirs[J]. Journal of Petroleum Science and Engineering, 2021, 202:108442.

 Scan QR Code
 Scan QR Code
Phone: 400-060-3233
After-sales: 400-060-3233


Back to Top