
In this study, a low-field Nuclear Magnetic Resonance (NMR) device with the ability to adjust the sample temperature was used to measure the unfrozen water content of frozen soil samples taken from the Tibetan Plateau.
Based on low-field NMR theory, two cutoff values were proposed to quantitatively identify three types of unfrozen water in frozen soils (free water, capillary water, and bound water).
The effects of soil characteristics on these three different types of unfrozen water during the soil freezing process were analyzed.
The results show that the unfrozen water content of soils can be divided into three stages: unfrozen, rapid decline, and residual stage.
In the rapid decline stage, the unfrozen water content gradually increases with the increase of clay or clay mineral content, and at a certain temperature, the unfrozen water content increases with the increase of sand content.
Due to the complex pore structure of the soil, clay mineral composition, and cohesive forces, a certain amount of water in the soil remains unfrozen at sub-zero temperatures, known as unfrozen water. The moisture content of unfrozen water significantly impacts the dynamic, hydraulic, and thermodynamic properties of frozen soils. Therefore, studying the content of unfrozen water and its influencing factors is crucial for understanding the hydrological environment and engineering design in cold regions.
Clay is a fine-grained natural soil material containing some clay minerals. The clay content and clay mineral content in the soil result in differences in physical properties between soils. Therefore, it is important to study how soil properties (such as clay content and clay mineral content) influence the content of unfrozen water in frozen soils.
Various methods and techniques can be used to measure the unfrozen water content in frozen soils, including thermal resistance temperature probes, capacitance methods, differential scanning calorimetry, time domain reflectometry, low-field NMR, etc. Among these, time domain reflectometry and low-field NMR are the most commonly used methods. Time domain reflectometry is fast, inexpensive, and portable, but it remains unclear whether the dielectric constant of soil measured by time domain reflectometry can effectively determine pore water content.
On the other hand, nuclear magnetic resonance has been proven to help study the unfrozen water content in frozen soils without damaging the soil or interfering with the samples.
In recent decades, compared to studies on rock pore water classification, research on soil pore water classification has been limited and it is difficult to further analyze the types of pore water, especially to differentiate between free water, capillary water, and bound water.
The application of low-field NMR technology not only enables the measurement of unfrozen water content in frozen soils but also classifies the pore water in the soil.
The experimental samples were taken from the Tibetan Plateau. A total of three soil samples were collected, with an average altitude of 4300 meters for each location. The samples were named S1, S2, and C.
In this study, an NMR instrument with real-time temperature control (MacroMR12-150H-I, Suzhou Niumai Analytical Instruments Co., Ltd.) was used to measure the unfrozen water content during the freezing process of soil. The instrument is shown below:
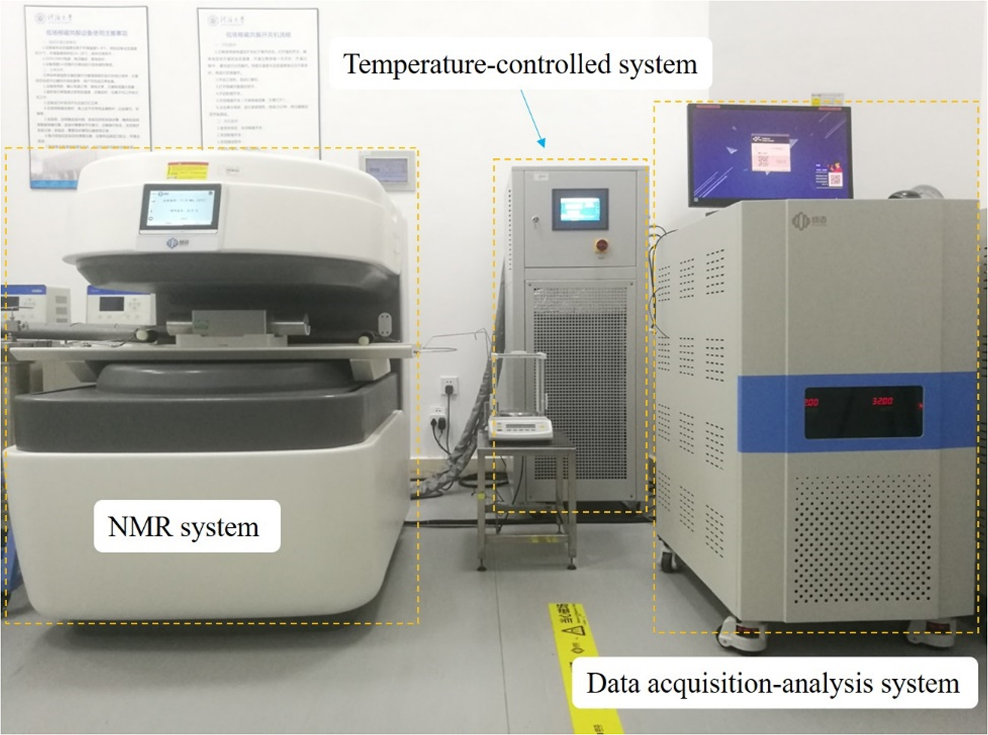
Figure 1: Niumai Low-Field NMR Device
The soil samples were dried in an oven at 110°C for 12 hours and then crushed. The Particle Size Distribution (PSD) of the soil samples was determined using a standard sieve and densimeter. The PSD curves for the three soil samples are shown below. After the PSD measurement, the samples were analyzed with a DX-2700 X-ray diffractometer to determine the mineral composition of the soil samples.
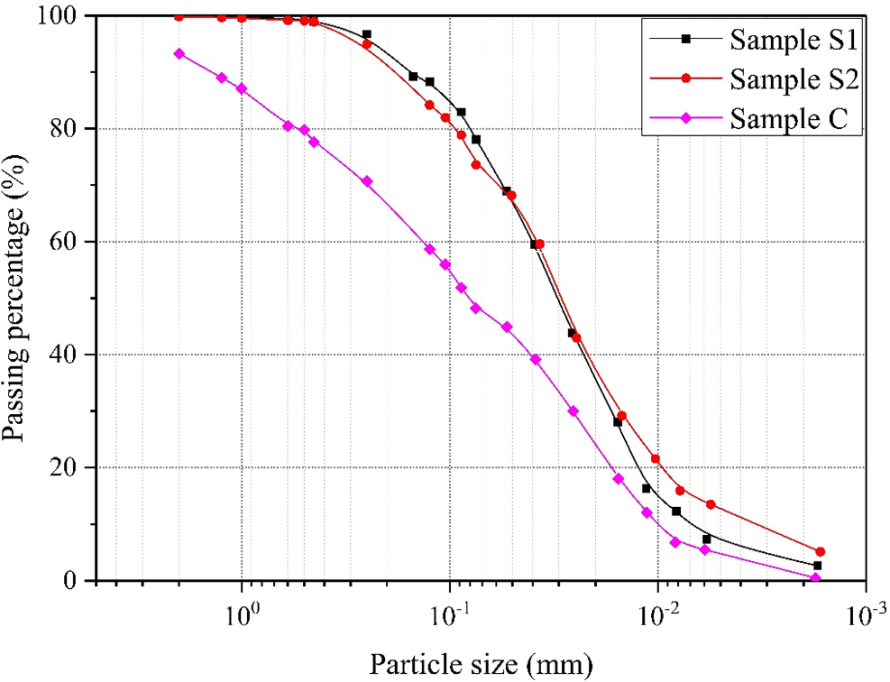
Figure 2: Sample Pore Size Distribution
Next, the cylindrical soil samples were prepared for NMR testing by layer-wise compaction. The porosities of samples S1, S2, and C were 42.16%, 43.55%, and 34.67%, respectively. Before the NMR test, the prepared cylindrical samples were saturated using a vacuum saturation device. The procedure was as follows: the samples were placed in a container (to prevent sample damage), and the container was placed in a sealed saturation chamber, vacuumed, and then deionized water was injected. The samples were saturated under 10 MPa pressure for 24 hours. The saturated soil samples were wrapped in plastic film and left to equilibrate for another 24 hours.
The prepared cylindrical samples were placed in the NMR sample tubes for testing. At 13 preset points (+15°C, +8°C, +2°C, 0°C, -1°C, -1.5°C, -2°C, -3°C, -5°C, -10°C, -15°C, -20°C, and -30°C), the sample’s environmental temperature was gradually decreased from +15°C to -30°C. At each temperature setpoint, the temperature was stabilized for at least 30 minutes before the NMR signal test, after which the next temperature setpoint was reached and tested, finally resulting in complete test results.
To accurately calculate the content and changes of the three types of water, it is necessary to distinguish between them (free water, capillary water, and bound water). In NMR theory, the T2 is variable for water distributed in different pores, with different relaxation times corresponding to different types of water. The strength of the physical and chemical reactions between pore water and soil particles decreases with the distance from the particle surface, and the freezing point of bound water is lower than that of capillary and free water.
Although different types of pore water can be distinguished based on T2 cutoff values, these values are not fixed, and different samples may use different T2 cutoff values to distinguish the three types of unfrozen water.
A single T2 cutoff point can only distinguish up to two different types of pore water, and thus is insufficient to identify all types of unfrozen water (free water, capillary water, and bound water) across a broad temperature range. In this study, two T2 cutoff points were proposed to distinguish free water, capillary water, and bound water.
Based on the T2 distribution curves of soil samples S1, S2, and C during the freezing process at different temperatures.
It was found that when the temperature was between 15°C and -2°C, the T2 curve intersected at a point. As the temperature increased, on the left side of the intersection, the NMR signal intensity increased, and on the right side, the signal intensity decreased. The intersection point is called cutoff point 2, which is located between free water and capillary water.
The cutoff values for S1, S2, and C were 2.95, 1.84, and 3.92 milliseconds, respectively. When the temperature dropped below -2°C, the T2 curve continuously moved leftward until the temperature reached -10°C;
When the temperature was between -10°C and -30°C, the T2 curve no longer moved, as this type of pore water is fixed. The endpoint between -10°C and -30°C is called cutoff point 1, which distinguishes bound water from capillary water.
The cutoff values for S1, S2, and C at point -1 were 1.65, 1.53, and 1.77 milliseconds. Based on the analysis above, free water, capillary water, and bound water can be distinguished by two T2 cutoff points. The classification of water for the three samples is shown below.

Figure 3: T2 Relaxation Distribution Curves of Three Samples at Different Temperatures
2. Changes in unfrozen water content with temperature
Figures a-d show the temperature-dependent behavior of different types of water. Temperature is the direct factor driving the changes in unfrozen water content. The trend of each water type’s curve is relatively consistent.
The change can generally be divided into three stages: unfrozen stage (I), rapid decline stage (II), and residual stage (III).
In the first stage, the unfrozen water content remains constant; when the temperature falls below a certain negative value, the content of all three types of unfrozen water decreases rapidly; when the temperature in the third stage is lower than -10°C, the unfrozen water content in the soil stabilizes, with free water and capillary water reaching zero, and only bound water remains, which is called the residual stage.
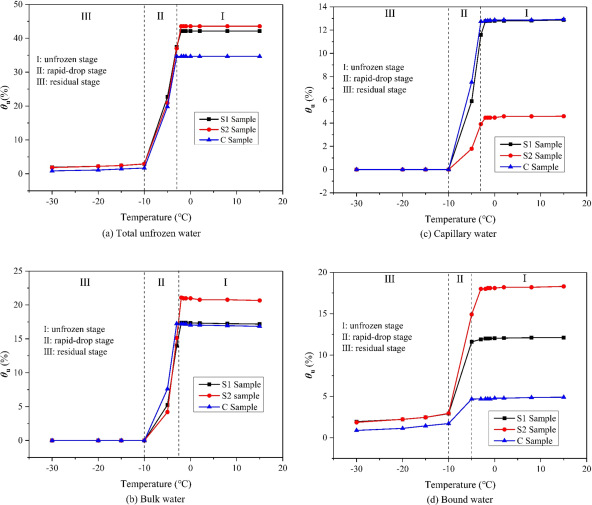
Figure 4: Relationship Between Unfrozen Water Content and Temperature for Three Samples
3. The effect of clay content on thawed water content
It is generally believed that clay content is an important factor influencing the water-soil system. Therefore, the effect of clay content on unfrozen water content during soil freezing must be considered. First, the clay content in the soil samples needs to be determined. Different countries and regions use different classification methods. In this study, the USDA/FAO system was used. As shown in the table below, S1 and S2 have relatively high clay and silt content, while C has a higher sand content and lower clay and silt content. The clay content of S1, S2, and C is 3.31%, 6.44%, and 2.98%, respectively.
Table 1: Clay Content of the Samples
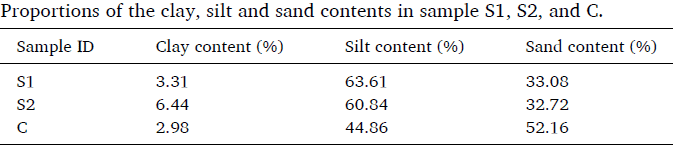
Figure 4(d) shows that sample S2, with the highest clay content, has the highest unfrozen water content. Moreover, when the temperature is between -3°C and -5°C, the change rate of unfrozen water content is the smallest for samples with lower clay content. For sample C, which has the lowest clay content, the rate of change of unfrozen water content with temperature is the smallest.
In other words, samples with lower clay content have a higher initial freezing temperature for bound water. At the same time, the rate of decrease varies between samples, with samples with higher clay content showing a faster decline.
4. The effect of clay mineral content on unfrozen water
In order to study the effect of clay mineral content on unfrozen water content in soils, X-ray diffraction was used to analyze the mineral composition of each sample. The test results are shown in Figure 5. It can be seen that all the soil samples contain common minerals, namely illite, chlorite, quartz, and kaolinite. In addition, each sample contains some other mineral components.
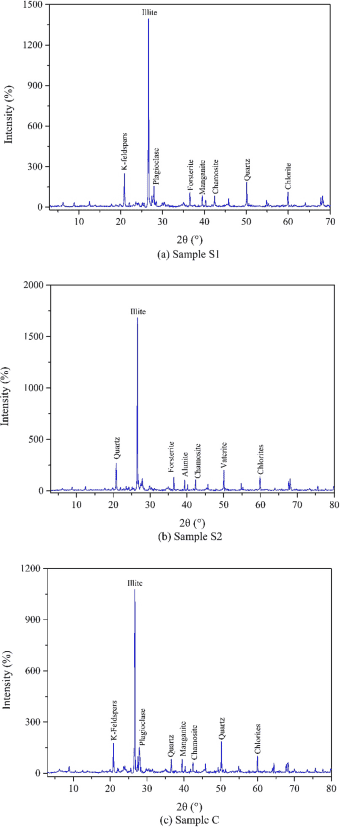
Figure 5: X-ray Spectrum
Table 2: Clay Mineral Information for the Three Samples
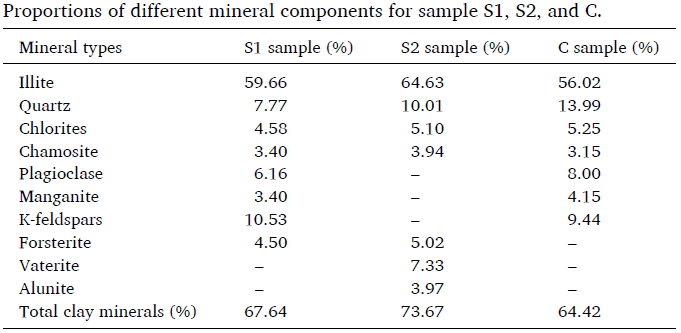
Table 2 shows that the main mineral contained in all the soils is illite, which accounts for more than half of the detected minerals. The clay mineral content of S1, S2, and C is 67.64%, 73.67%, and 64.42%, respectively. Clay minerals are very fine-grained, with many negative charges on their surfaces, and the large specific surface area of these sticky mineral particles can form more sticky hydration films. In other words, clay minerals significantly affect the bound water content, with a greater specific surface area leading to more bound water.
This paper uses LF-NMR technology to study the effect of soil characteristics on the unfrozen water content during the soil freezing process. The following conclusions were drawn:
1) Based on the changes in the T2 curves during the freezing process, two T2 cutoff points were established at the intersection of T2 curves between 15°C and -2°C, and the endpoint of T2 curves between -10°C and -30°C. These points divide T2 into three parts corresponding to three different types of water: free water, capillary water, and bound water.
2) The freezing process of different types of water can be divided into three stages: unfrozen stage (I), rapid decline stage (II), and residual stage (III).
3) Clay content and total clay mineral content mainly affect the freezing characteristics of bound water. The higher the clay content and total clay mineral content, the greater the specific surface area and bound water content.
[1] Chen Y, Zhou Z, Wang J, et al. Quantification and Division of Unfrozen Water Content During the Freezing Process and the Influence of Soil Properties by Low-field Nuclear Magnetic Resonance[J]. Journal of Hydrology, 2021, 602(3-4):126719.

 Scan QR Code
 Scan QR Code
Phone: 400-060-3233
After-sales: 400-060-3233


Back to Top