
Chromium (VI) (Cr(VI)) is a toxic metal ion widely found in industrial wastewater. In order to reduce hexavalent chromium pollution, many technologies have been developed over the past decades to photocatalytically reduce Cr(VI) to trivalent chromium (Cr(III)). However, due to the deposition and stratification of catalyst particles during wastewater treatment, the complex photoreduction process often hinders the practical effectiveness of photocatalysts in reducing Cr(VI) during wastewater treatment. Exploring and understanding the impact of catalyst particle deposition and stratification on the photoreduction process has been a long-standing challenge in this field. In this study, we demonstrate that this issue can be addressed by using the low-field nuclear magnetic resonance (LF-NMR) relaxation stratification testing method. Using paramagnetic Cr(III) cations as molecular probes, we successfully monitored the Cr(VI) photoreduction process by detecting the relaxation times of the photoreduction. The study investigates and discusses the impact of catalyst settling and light wavelength on photocatalysis. The results show that LF-NMR relaxation holds great potential for studying Cr(VI) photoreduction in industrial wastewater treatment.
Through the photoreduction process, highly toxic Cr(VI) can be reduced to the less toxic Cr(III) on photocatalysts such as TiO2, ZnO, CdS, and MoF, which can be seen as a simple, clean, and convenient strategy. Photoreduction of chromium in solution is generally considered to be a homogeneous process. However, in real macroscopic reaction systems, precipitation and stratification often occur during the photoreduction process. Thus, the photoreduction process in a reaction system becomes more complex than in a homogeneous reaction system. Gaining deeper insight into the photoreduction process at different depths in the reaction system can significantly aid the design of high-performance photocatalysts. The challenge of monitoring the photoreduction process at different depths in the reaction system has sparked considerable research interest in this field, with low-field nuclear magnetic resonance technology demonstrating significant application potential.
In this study, we demonstrate that by using LF-NMR relaxation, it is possible to monitor the Cr(VI) photoreduction process at different depths in solution. A nuclear magnetic resonance stratification detection method was developed to detect the Cr(VI) photoreduction process at different depths in the sample. In situ detection was achieved by introducing light illumination into the NMR probe. This combination provides a scenario in NMR measurements that closely resembles real-world applications in wastewater treatment. NMR results clearly show that the settling of catalyst particles has a significant impact on the photoreduction process, and Cr(VI) photoreduction occurs differently at various depths. The effects of light intensity and catalyst concentration on the photoreduction process were also studied.
The method to quantify the concentration of paramagnetic ions in solution using LF-NMR relaxation is represented by the following equation:
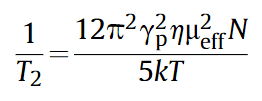
Where, longitudinal relaxation rate: (1/t2); hydrogen gyromagnetic ratio: (γp); effective magnetic moment of Cr(III) ions: (ηeff); viscosity of Cr(III) solution: (μ); Boltzmann constant: (k); temperature: (T); concentration of paramagnetic ions: (N).
Based on the measurement of T2, the above equation can be used to estimate the concentration of paramagnetic ions in solution. From the equation, it is observed that a fixed T2 value corresponds to the concentration of chromium in the solution. Therefore, for a homogeneous, stable chromium solution, the T2 value for each layer remains relatively constant (Fig. 1a). It was observed that when the Cr(III) ion concentration was 0 mg/L, the T2 value of each layer was about 2255 ms. As the Cr(III) ion concentration increased, the T2 values for each layer decreased. When the Cr(III) ion concentration was 20 mg/L, the T2 value of each layer was about 298 ms (Fig. 1b). For the same concentration, the T2 values of different layers were nearly identical. A linear fit of 1/T2 was performed for the mixed solution with different Cr(VI) and Cr(III) concentration ratios, as shown in Fig. 1c.
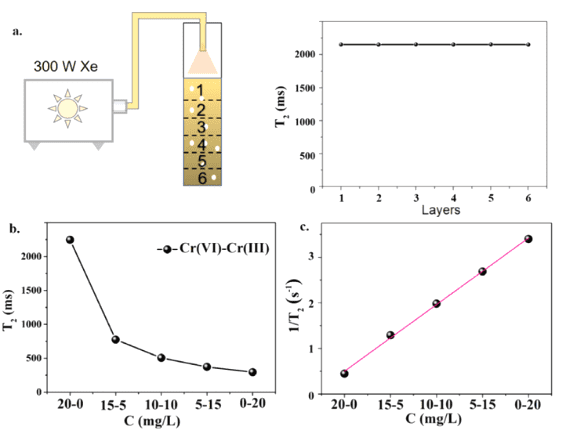
Fig. 1 a, Photoreduction experimental setup for Cr(VI) and T2 values of Cr(III) solution at different depths. b, Changes in T2 values of Cr(III) solution with concentration. c, Linear fit of 1/T2 for Cr(III) solution with different concentration ratios.
Using a nuclear magnetic resonance spectrometer (NMI20-015V-I, Suzhou Niumag Analytical Instruments Co., Ltd.), equipped with a 10 mm NMR tube, the T2 values were measured at 0.5 T (21.3 MHz, 1H). The gradient field strength in the x direction was 0.0132 T/min, in the y direction (layer selection direction) was 0.13 T/m, and in the z direction was 0.1479 T/m. The layer selection thickness was 2.5 mm and the total sample volume was 2 mL. The photoreduction of Cr(VI) in different layers of the sample in the NMR tube was studied (Fig. 2). After ultrasonic treatment, the sample was left for 2 hours before conducting the NMR experiment. In this case, the precipitation of catalyst particles was clearly observed in the NMR tube. The distribution state of the catalyst particles is shown in the schematic in Fig. 2. Fig. 2 also illustrates the relationship between T2 and the photoreduction time in different layers of the NMR tube. It was observed that the T2 values for all layers were identical before illumination. After turning on the illumination, the changes in T2 values varied between layers, reflecting the photoreduction process in the tube. As the illumination time increased, the differences became very pronounced. While all layers showed a noticeable decrease in T2 values, the T2 values for different layers were distinct. The lowest T2 value was observed in the sixth layer, which is closest to the deposited catalyst, while the upper layers, farther from the catalyst surface, showed a slower decrease, which is temporarily attributed to different concentrations of catalyst particles in each layer. The results from Fig. 2 clearly show that the different paramagnetic states of Cr(III) can serve as molecular probes for monitoring the photoreduction process at different locations in the sample. Notably, the analysis of the data in Fig. 2 indicates that a large amount of Cr(VI) in the upper layers had been reduced to Cr(III).
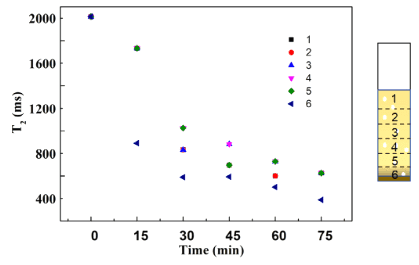
Fig. 2 T2 values for different layers of the sample as a function of illumination time. The Pt/CN photocatalyst was used in the experiment. Experimental conditions: catalyst weight = 5 mg, Cr(VI) concentration = 20 mg/L, full spectrum light illumination.
As light passes through the solution, photon flux likely decreases along the light path. The deeper the layer, the weaker the light intensity. Therefore, it is expected that the photoreduction process near the bottom of the sample will be suppressed due to the reduction in light flux. Interestingly, it was found that the sixth layer, which was the deepest, had the shortest T2 value, indicating the highest concentration of Cr(III) and the greatest reduction rate of Cr(VI). These anomalous results can be attributed to a balance between the Cr(VI) photoreduction process and the catalyst concentration. Although the light intensity is the weakest in the sixth layer, the catalyst concentration is highest there due to precipitation, and the high concentration of catalyst can significantly promote the photoreduction process. Fig. 2 also shows that, unlike the relatively lower catalyst concentration in the surface layer, the surface layer, which receives the highest illumination, has the shortest T2 value indicating the highest concentration of reduced Cr(III). In contrast, the lower layers, with higher concentrations of catalyst, are likely not under adequate illumination, leading to lower overall light utilization in the sample.
Fig. 3 shows the variation in T2 values for different layers when Pt/CNN photocatalyst was used. Unlike the Pt/CN photocatalyst studied in Fig. 2, the Pt/CNN photocatalyst disperses well after exfoliation. Furthermore, when the sample was kept for 2 hours before the NMR experiment, no noticeable precipitation of platinum/carbon nanotube catalyst particles was observed in the NMR tube. As the illumination duration increased, T2 values for all layers showed a downward trend, consistent with the results observed in Fig. 2, indicating the photoreduction of Cr(VI) to paramagnetic Cr(III) in the sample. Interestingly, within the first 30 minutes, the photoreduction efficiency of the Pt/CNN system increased from the bottom layer to the top layer, which contrasts with the observations in Fig. 2. In the surface layer, the catalyst is under the highest illumination, and the shortest T2 indicates the highest concentration of reduced Cr(III). In the bottom layer, the catalyst is under the weakest illumination, and the longest T2 reflects the lowest concentration of Cr(III). However, after increasing the illumination duration, this trend reversed. It was found that after 40 and 50 minutes of illumination, T2 values from different layers became uniform again, indicating that the Cr(III) concentration had become similar across layers. The disappearance of concentration differences might be due to diffusion of Cr(III) driven by different concentrations in different layers. It is noteworthy that in the Pt/CN system, the Cr(VI) concentration reached 0 mg/L after 75 minutes, which is about twice the time of the Pt/CNN photocatalyst, suggesting that the dispersion of the photocatalyst might significantly affect the photoreduction performance.
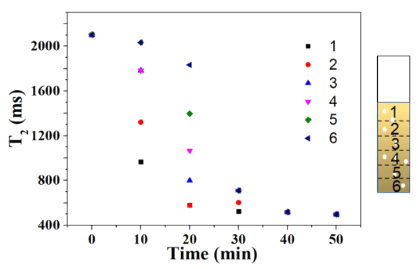
Fig. 3 T2 values of different sample layers as a function of illumination time. The Pt/CNN photocatalyst was used in the experiment. Experimental conditions: catalyst weight = 5 mg, Cr(VI) concentration = 20 mg/L, full spectrum light illumination.
To study the effect of photon flux on Cr(VI) photoreduction during the photocatalysis process, in this case, the light source was switched to visible light (λ > 420 nm) during the NMR measurement. Fig. 4 shows the T2 values of different layers of the Pt/CNN system before and after illumination. Except for the light source, all other experimental conditions were the same as those in the related experiments in Fig. 3. As the illumination duration increased, T2 values from all layers decreased, indicating that Cr(VI) was being reduced to paramagnetic Cr(III) under illumination. Unlike the observations in Fig. 3, the minimum T2 values in Fig. 4 were consistently observed in the sixth layer, indicating the highest photoreduction rate in this layer. This suggests that even with well-dispersed catalyst particles in the sample, visible light illumination leads to different photoreduction rates in different layers. In contrast to the observations in Fig. 3, we conclude that the photoreduction process in the sample also depends on the wavelength of the light. This can be attributed to light scattering and diffraction, which might be related to the size of the particles. In other words, Pt/CNN catalysts with smaller particles, due to their high specific surface area, cause more light scattering loss under visible light (λ > 420 nm).
Fig. 4 reflects that for two samples illuminated for 15 and 30 minutes, the T2 values from the fifth layer occasionally resembled those from the third layer. This may be related to the rapid reduction of Cr(VI) to paramagnetic Cr(III) in the sixth layer, potentially causing local diffusion of Cr(VI) from the fifth to the sixth layer. The reduction of Cr(VI) in the fifth layer led to an increase in T2 values. In principle, Cr(III) in the sixth layer could temporarily increase, thereby diffusing into the fifth layer.
In this work, we conducted a detailed study of the Cr(VI) photoreduction process using nuclear magnetic resonance relaxation stratification detection. The results show that the Cr(VI) photoreduction process in the NMR tube behaves differently at different depths. The NMR results indicate that precipitation leads to higher catalyst concentration at the bottom of the tube, resulting in higher concentrations of reduced Cr(III) near the deposited catalyst. For systems with well-dispersed catalysts, the photoreduction strongly depends on the light penetration depth. Therefore, the size of catalyst particles and the wavelength of light are critical to photoreduction. These findings provide guidance for the design of high-performance photocatalysts. These NMR results clearly show that paramagnetic Cr(III) cations can serve as sensitive molecular probes to monitor the Cr(VI) photoreduction process. This work extends the application of LF-NMR relaxation measurements by developing an effective method to quantify photoreduction occurring at different spatial locations in the sample, providing new insights into the analysis of multiphase catalytic reactions.
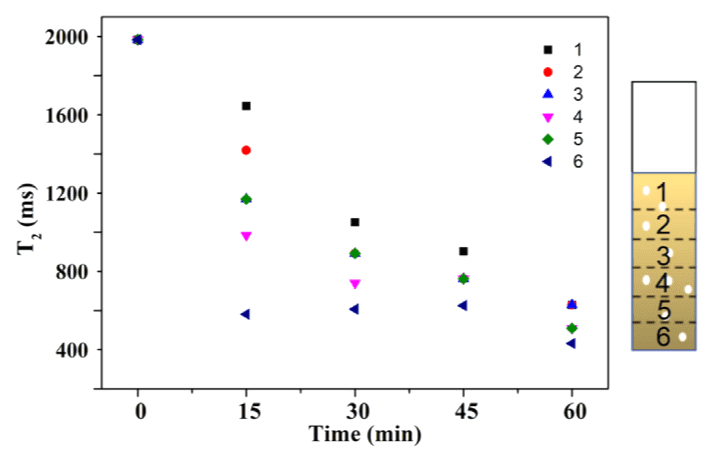
Fig. 4 T2 values for different sample layers as a function of illumination time. The Pt/CNN photocatalyst was used in the experiment. Experimental conditions: catalyst weight = 5 mg, Cr(VI) concentration = 20 mg/L, and visible light (λ > 420 nm) illumination.
Bei-Bei Xu, Jing-Xian Dong, et al. Monitoring Cr(VI) photoreduction at different depths by operando low-field NMR relaxometry [J]. Magnetic Resonance Letters.

 Scan QR Code
 Scan QR Code
Phone: 400-060-3233
After-sales: 400-060-3233


Back to Top