
Natural mud-rich sandy gas hydrate reservoirs have been widely discovered in the South China Sea. However, the phase transition behavior of CH4 hydrate (MH) and the associated pore structure evolution and fluid migration patterns remain unclear, warranting further investigation.
This study, based on low-field nuclear magnetic resonance (NMR) technology, investigates the pore structure evolution during MH generation and decomposition processes in mud-rich sandy sediments, as well as the water migration and transformation patterns.
According to T2 spectral measurements, MH first grows in small pores (pore size < 1 μm), then expands into larger pores (pore size > 10 μm). The presence of clay, specifically sodium montmorillonite (Na-MMT), effectively delays the overall growth dynamics of MH. During depressurization, MH begins to decompose in the large pores. The free water generated during decomposition migrates into the clay’s small pores and some is transformed into clay-bound water.
MRI visualization analysis describes the spatial heterogeneity distribution of MH and residual water. The experimental results provide possible explanations for the spatial heterogeneity of MH in mud-rich sandy sediments and the fluid migration behaviors during the energy recovery process in MH reservoirs.
Natural gas hydrate is a hot topic in the exploration and development of unconventional oil and gas resources worldwide. The South China Sea holds vast amounts of natural gas hydrate resources, but they are mostly located in mud-rich sandy hydrate reservoirs, which are challenging to exploit.
Fine-grained clay particles are distributed within sandy pores, and the expansion of clay, pore water migration characteristics, and transformation patterns have not been fully understood in terms of their effects on methane hydrate dynamics in the pores. There has been limited research on the gas hydrate formation and decomposition phase dynamics and the resulting pore structure evolution under the influence of clay minerals in the reservoir. At the pore scale, the impact of fine-grained clay particles on the gas-water-sand output patterns in the development of mud-rich sandy gas hydrate reservoirs remains unclear. These issues require further research.
Low-field nuclear magnetic resonance (NMR) technology offers unparalleled advantages in quantifying the water evolution in pore spaces due to MH phase changes, particularly in measuring pore structure changes and the gas hydrate generation/decomposition kinetics, as well as characterizing hydrate saturation in sediments.
By analyzing the T2 spectra, the study systematically investigates the effects of expanding clays on MH formation and decomposition behavior in the pores, as well as the resulting changes in PSD, pore structure, and pore water distribution. Its significance and originality lie in the exploration of the impact and transformation of clay-bound water in clay minerals from the perspective of peak separation and evolution, as well as the pore structure evolution during MH formation and decomposition.
The study reveals the mechanism by which methane hydrate formation and decomposition, influenced by small-grained clay minerals, affects the pore structure and pore water migration in mud-rich sandy porous media. The results provide foundational experimental data and theoretical guidance for the subsequent safe and efficient extraction of mud-rich sandy natural gas hydrates.

The materials used in this study include sodium montmorillonite, quartz sand, and CH4 gas. The equipment used to monitor the production and decomposition of gas hydrate is a low-field nuclear magnetic resonance device, manufactured by Suzhou Newmai Analytical Instruments Co., Ltd., Model: MacroMR02-100H-I.
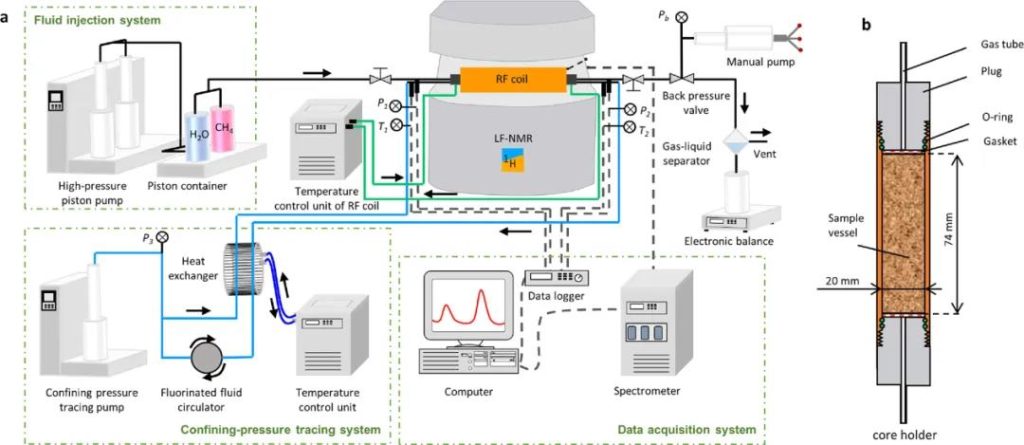
Figure 1 LF-NMR Schematic Diagram
The experimental procedure is shown in Figure 1, briefly describing the sample preparation, MH formation, and decomposition process:
(1) Clean and dry the holder.
(2) Prepare the mud-rich sandy medium (mass ratio of Na-MMT to quartz sand is 20:80), load it into the holder, and add the appropriate amount of water to prepare samples with different initial water saturations.
(3) Stabilize the samples for 12 hours to ensure uniform water distribution.
(4) Remove the residual air and pressurize with CH4 gas at 10.0 MPa at 15°C. Then stabilize for 3 hours to test the sealing ability.
(5) MH formation is induced by cooling the apparatus to T = 2°C. During the experiment, start the LF-NMR analysis system to obtain the T2 spectra and MRI images of the samples. When the signal intensity remains constant, the MH formation process is considered complete.
(6) MH decomposition is induced by depressurization at a constant T = 2°C. The pressure is reduced to P = 3.0 MPa within 15 minutes, and MH decomposition is triggered at P = 3.0 MPa. The LF-NMR analysis system is started to obtain the T2 spectra and MRI images. When the signal intensity remains constant, the MH decomposition process is considered complete.
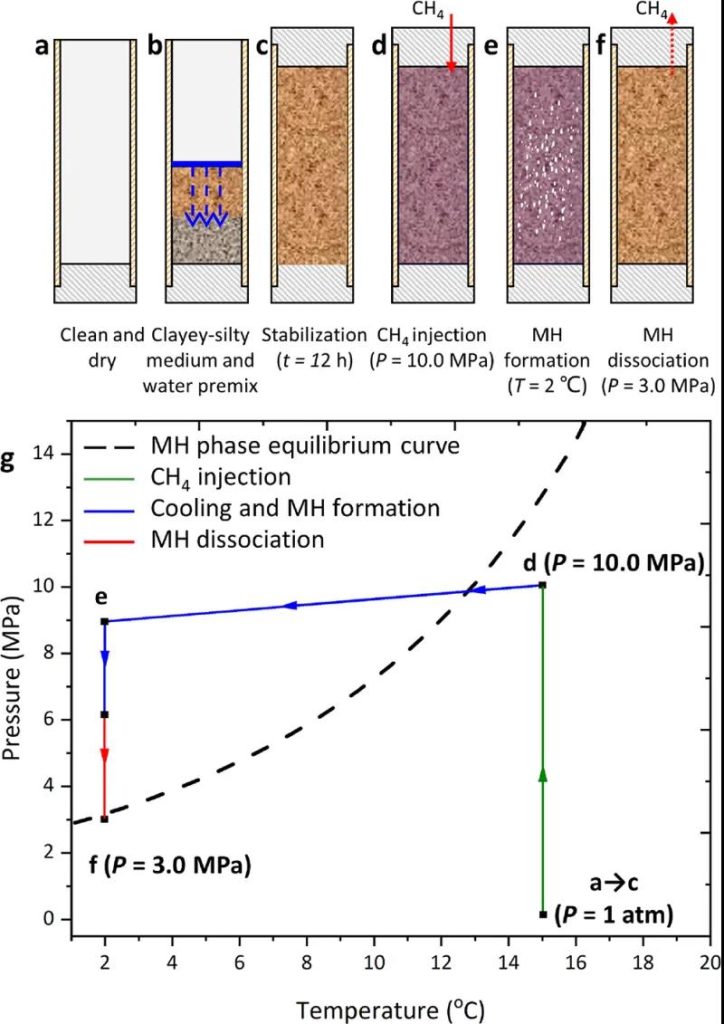
Figure 2 LF-NMR Experimental Procedure Diagram (a−f), P−T Trajectory and Relationship with MH Phase Equilibrium Curve (g)
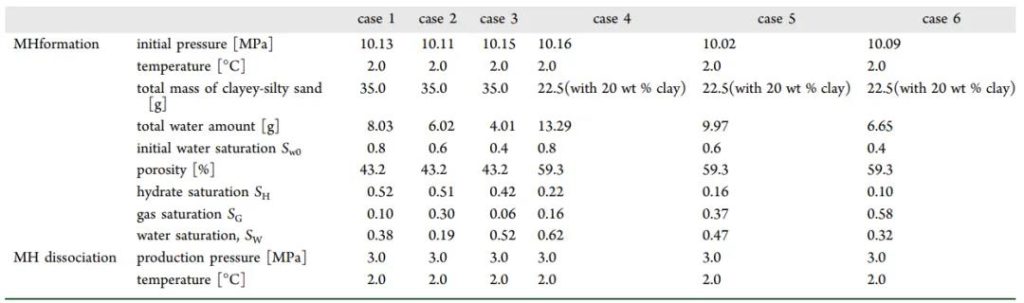
Figure 3 Experimental Conditions
Using the self-built in-situ low-field nuclear magnetic resonance (LF-NMR) instrument, the formation and decomposition dynamics of methane hydrate (MH) in the presence of expanding clay minerals—montmorillonite—within mud-rich sandy hydrate reservoirs were revealed at the pore scale, along with the clay expansion/contraction effects and pore structure evolution characteristics.
The author proposes a method of calibrating pore size using high-pressure mercury intrusion (MICP) combined with nuclear magnetic resonance technology, and designed experiments to observe MH formation and decomposition in quartz sand and mud-rich sandy porous media at various initial water saturations (Sw0 = 40-80%). The study provides insights into the pore structure changes and pore water migration rules caused by expanding clay minerals, revealing the impact of small-grained clay minerals on methane hydrate formation and decomposition in mud-rich sandy porous media, and the role of pore structure and water migration.
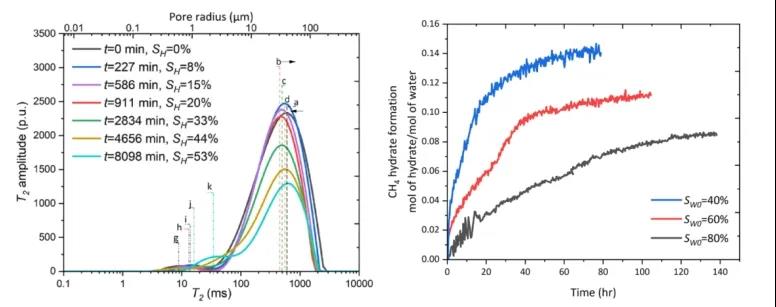
Figure 4 Evolution of the T2 Spectrum During CH4 Hydrate Formation Process in Quartz Sand Medium; Growth Evolution of CH4 Hydrate in Quartz Sand Medium at Different Initial Water Saturations
The author first utilized high-pressure mercury intrusion combined with nuclear magnetic resonance technology for pore size calibration, successfully quantifying the relationship between the T2 spectrum and pore size distribution (PSD), obtaining real-time pore evolution characteristics.
Figure 4 shows the evolution of the T2 spectrum during the CH4 hydrate formation process in quartz sand and mud-rich sandy media, along with the kinetics of CH4 hydrate growth.
The growth of hydrate in quartz sand leads to a right shift in the T2 spectrum, indicating a decrease in pore surface area (S/V). The methane hydrate growth process is divided into two stages: a faster initial growth rate and a slower rate in the later stage. Under lower initial water saturation conditions, the hydrate grows faster at first due to a larger gas-liquid contact area.
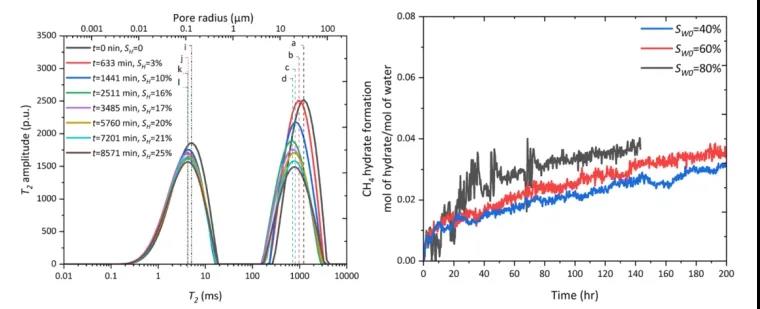
Figure 5 Evolution of the T2 Spectrum During CH4 Hydrate Formation in Mud-Rich Sandy Medium; Growth Evolution of CH4 Hydrate in Mud-Rich Sandy Medium at Different Initial Water Saturations
Figure 5 illustrates the shift of the T2 spectrum in the mud-rich sandy medium, first shifting left and then right. This indicates that the hydrate first forms in relatively large pores, then in smaller pores.
As the hydrate gradually expands from the pore edges towards the center, liquid water is driven towards the center, causing the pore surface area (S/V) to decrease. Solid hydrate does not contribute to the NMR signal under low-field conditions, and is thus considered as the skeleton. The growth rate of methane hydrate in mud-rich sandy media increases with the initial water saturation (Sw0). This is because clay-bound water is harder to transform into hydrate than free water. With increasing initial water saturation, the proportion of free water increases, which is more favorable for methane hydrate formation.
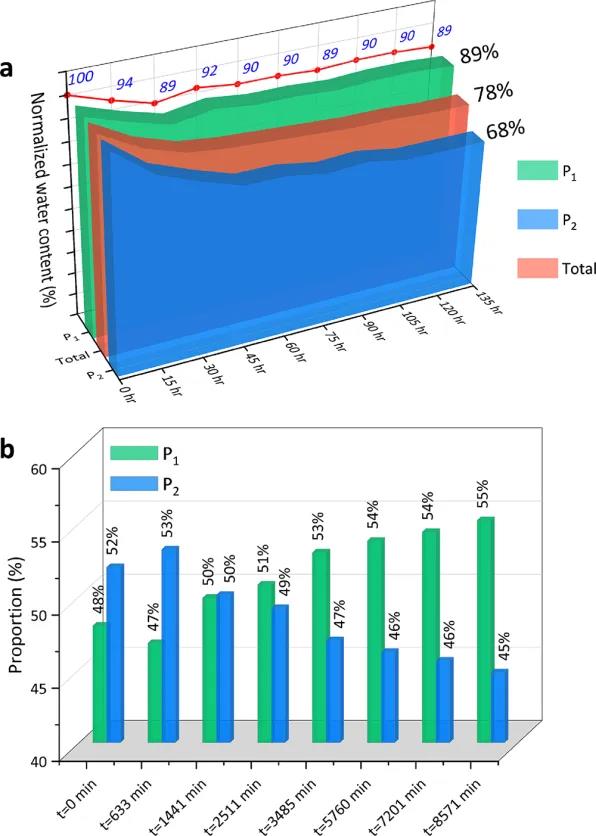
Figure 6 Evolution of CH4 Hydrate Formation Process in Mud-Rich Sandy Medium: (a) Evolution of Residual Water Content (Clay-Bound Water P1 and Pore Water P2); (b) Evolution of Residual Water Relative Content
Figure 6 shows the evolution of residual clay-bound water (P1) and pore water (P2) during the methane hydrate formation process in the mud-rich sandy medium.
2 The research results indicate that clay promotes hydrate formation in the early stages (about the first 30 hours), but the overall conversion rate of clay-bound water (P1) is relatively low, around 10%. Meanwhile, the free water (P2) in sandy pores is continuously consumed, with the final conversion rate reaching 32% (see Figure 6a). Figure 6(b) further confirms that clay-bound water (P1) is consumed first, indicating that clay promotes hydrate growth in the initial stage.
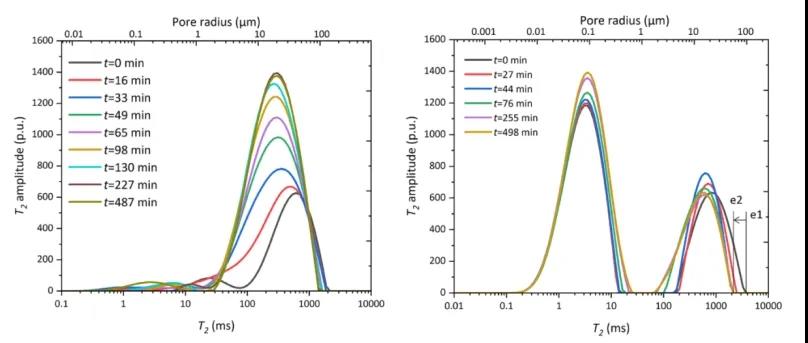
Figure 7: T2 spectrum evolution of CH4 hydrate decomposition process in quartz sand media; T2 spectrum evolution of CH4 hydrate decomposition process in muddy silty media
Figure 7 illustrates the T2 spectrum evolution during the CH4 hydrate decomposition process in quartz sand and muddy silty media. It can be observed that during depressurization, the water signal gradually increases, and the pore water redistributes (the T2 peak width and distribution change).
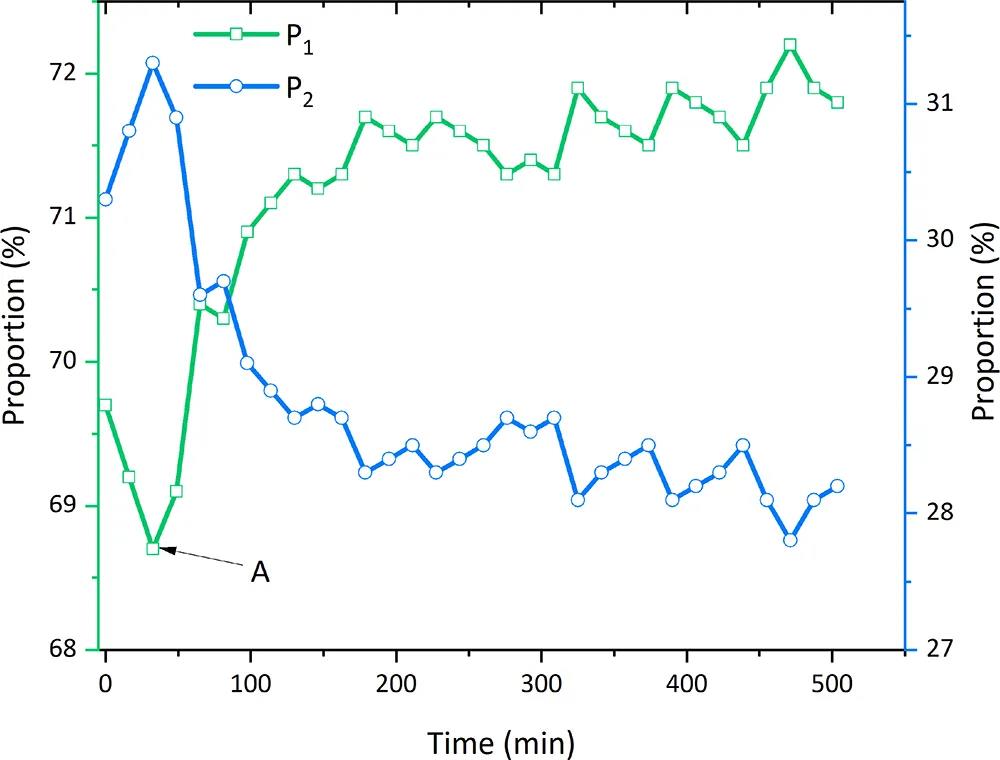
Figure 8: Evolution of relative content of clay-bound water and sandy pore water during CH4 hydrate decomposition process
Figure 8 shows that CH4 hydrate initially decomposes in large sandy pores, causing a rapid increase in P2 signal. Subsequently, it decomposes in clay small pores. After tA = 33 minutes, the produced water from large sandy pores gradually transforms into clay-bound water, accompanied by a decrease in free water (P2) signal and an increase in clay-bound water (P1) signal.
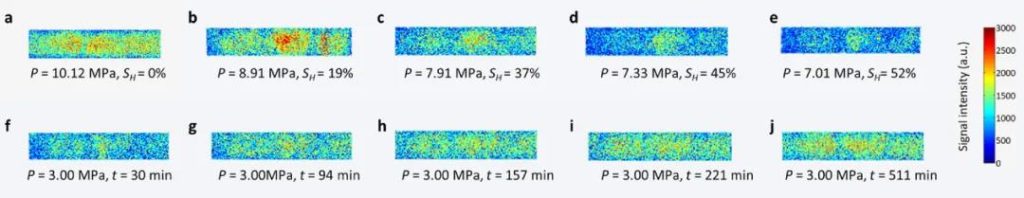
Figure 9: MRI images of CH4 hydrate formation and decomposition process in quartz sand
Figure 9 provides MRI images (using HSE sequence) of the CH4 hydrate formation and decomposition process in quartz sand at T = 2°C. The imaging information is related to the whole sample and is not sliced. Figures a to e represent hydrate formation, while figures f to j represent hydrate decomposition.
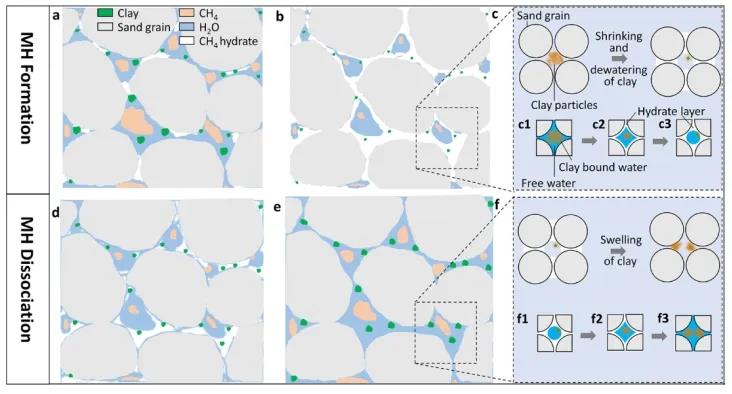
Figure 10: Mechanism diagram of pore water migration and pore structure change caused by CH4 hydrate formation and decomposition in the presence of montmorillonite
Based on the above analysis, Figure 10 illustrates the mechanism of CH4 hydrate formation and decomposition in muddy silty media. During hydrate formation, the clay distributed in large sandy pores influences the growth kinetics of the hydrate, gradually loses water, shrinks, and changes the pore structure (S/V decreases). During hydrate decomposition, the water absorption properties of clay cause the free water generated during decomposition to convert into clay-bound water, and the swelling of clay again changes the pore structure (S/V increases).
Low-field nuclear magnetic resonance (LF-NMR) provides unmatched advantages in quantifying in-situ free water and clay-bound water in the pore space of hydrate deposits caused by phase transitions.
In this study, LF-NMR was used to elucidate the formation and decomposition kinetics of CH4 hydrate in muddy silty media. By analyzing T2 spectra, the evolution of pore size distribution (PSD), pore structure, and free water distribution was systematically studied.
The research results contribute to understanding the CH4 recovery patterns and fluid production behavior of methane hydrates in clay-rich hydrate-bearing sediments.
1. The formation of CH4 hydrate fills the pores with solid hydrate, and the remaining water migrates to the centers of relatively larger pores and those with a narrower pore size distribution. The shift to the right in the T2 spectra indicates that during the formation of MH in muddy sand, the specific surface area of free water in the pores (surface area-to-volume ratio) continuously decreases.
2. In the presence of Na-MMT clay, significantly different pore sizes exist. MH first grows in small pores (pore size < 1 μm) and later in larger pores (pore size > 10 μm).
3. In the presence of Na-MMT, hydrate growth is promoted during the early stage of hydrate formation (about 30 hours), and clay-bound water is consumed. However, in muddy silty media, compared to sandy sediments, the overall hydrate growth kinetics are delayed, with only 10% of clay-bound water converting to MH, which is one-third of the conversion rate of sandy pore water.
4. Regarding decomposition, MH initially decomposes in large sandy pores. The presence of Na-MMT causes the water produced during decomposition to be absorbed by the clay and converted into clay-bound water.
5. Nuclear magnetic imaging clearly describes the heterogeneous spatial distribution of residual water generated by hydrate and pore fluid migration, visually representing the entire process of hydrate formation and decomposition.
[1] Ren J, Yin Z, Li Q, et al. Pore-scale investigation of CH4 hydrate kinetics in clayey-silty sediments by low-field NMR[J]. Energy & Fuels, 2022, 36(24): 14874-14887. (Featured on the journal cover)
 Scan QR Code
 Scan QR Code
Phone: 400-060-3233
After-sales: 400-060-3233


Back to Top