
This study uses customized low-field nuclear magnetic resonance (NMR) testing to investigate the moisture sorption behavior and its impact on pore structure in salt rock subjected to humidity cycling under different levels of damage. The tests were also conducted on centrifuged and saturated samples for supplementary analysis. The fluid-accessible pores in salt rock include mesopores (2–50 nm) and macropores (>50 nm). During the initial wetting phase of the first cycle, sorption in the mesopores lags behind that in the macropores. However, in the subsequent drying phase, the desorption in the mesopores is more significant and rapid compared to the macropores. Over a long-term treatment process, sorption continues, and the macropore volume of all samples decreases significantly, while the mesopore volume increases slightly. It is inferred that the larger viscous forces in the mesopores hinder both sorption and the replenishment of moisture, leading to the differences observed in the initial cycle. The continued sorption of brine activates two self-healing mechanisms in the macropores: diffusion and recrystallization, transforming continuous large fractures into isolated pores filled with recrystallized microstructures, effectively converting macropores into mesopores. In conclusion, this study describes the complex sorption behavior and pore structure evolution of salt rock under humidity cycling, influenced by self-healing mechanisms, providing new insights for evaluating the long-term stability and integrity of compressed air energy storage (CAES) salt caverns.
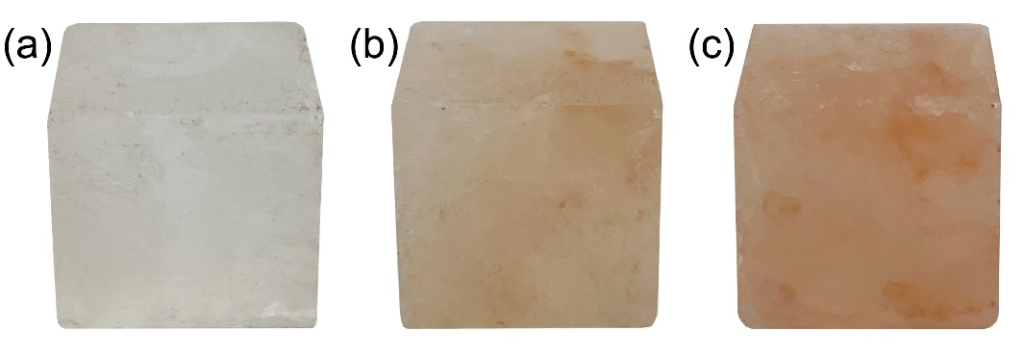
Figure 1 Salt rocks from Khewra mine: (a) white, (b) orange, and (c) red salt rocks
The selected rocks were line cut into cubic samples with dimensions of 15×15×45 mm to fit the 1-inch diameter coil of the NMR instrument.
As shown in Figure 3a, uniaxial compression was applied using a rock mechanics testing machine. A relatively long plane was selected to contact the loading plate as shown in Figure 2. Axial strain was measured using strain sensors.
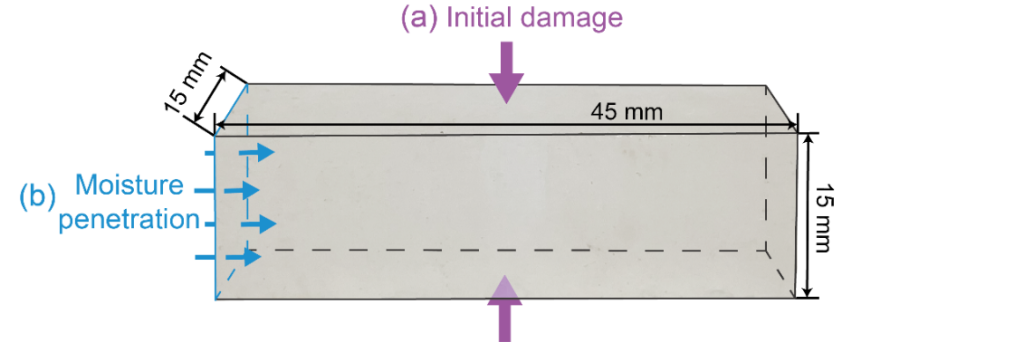
Figure 2 Experimental setup for each rock sample’s plane
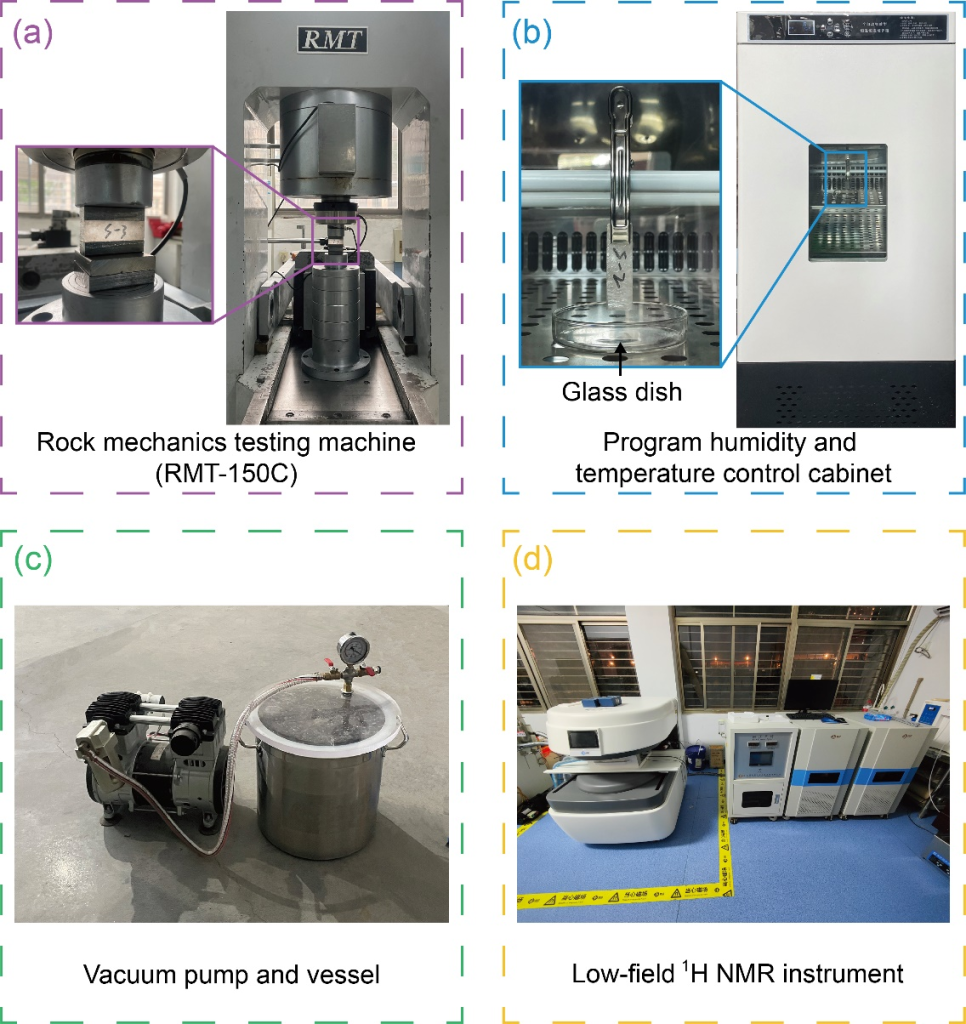
Figure 3 Experimental setup mentioned in this study
Under a displacement control rate of 0.3 mm/min, three samples were compressed to failure to obtain their average uniaxial compressive strength (UCS) and stress-strain curves.
The NMR tests were conducted on a low-field 1H NMR instrument (MacroMR12-150H-I NMR; China, Niumag), as shown in Figure 3d. The instrument’s magnetic field strength was 0.3 T, and the coil’s working frequency was 12 MHz.
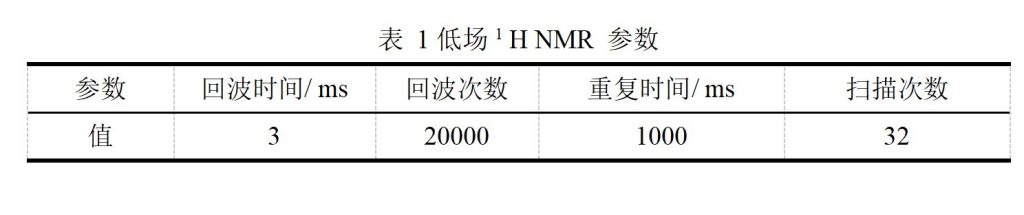
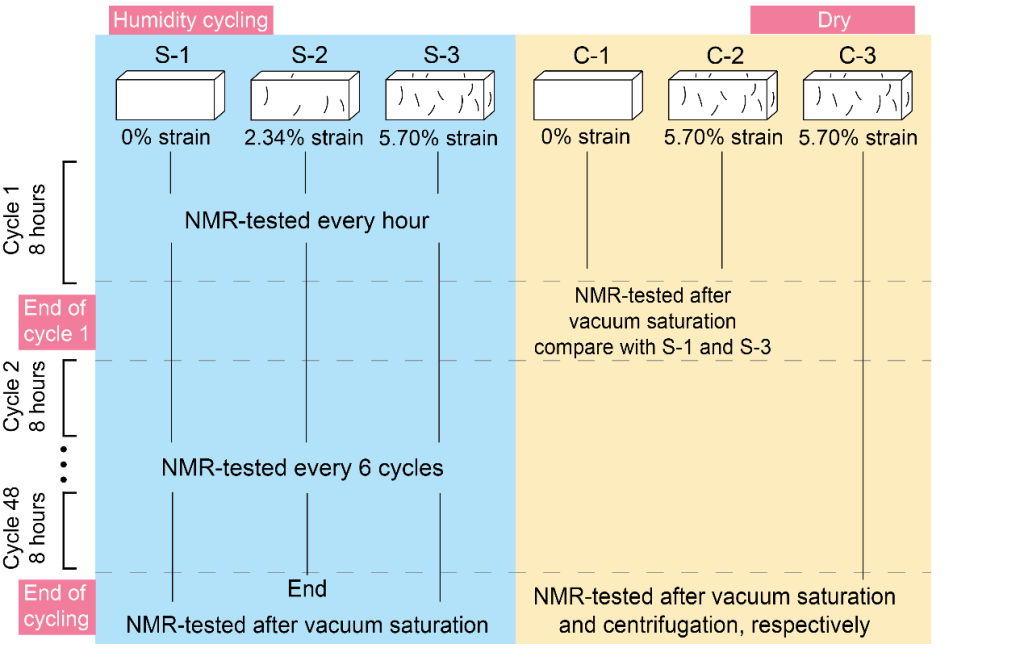
Figure 5 Experimental setup for each sample
Prior to humidity cycling, all six samples underwent NMR testing. These results served as a baseline and were subtracted from subsequent results to eliminate the influence of intrinsic signal sources such as closed pores within the material.
The specific testing scheme for each sample is shown in Figure 5. During the first cycle, three experimental samples were tested every hour to monitor moisture migration dynamics at different crack levels. After the first cycle, samples C-1 and C-2 were subjected to drying and saturation treatments, followed by NMR testing.
The experimental samples were subsequently tested every six cycles (48 hours). Samples S-1 and S-3 underwent vacuum saturation and NMR testing again.
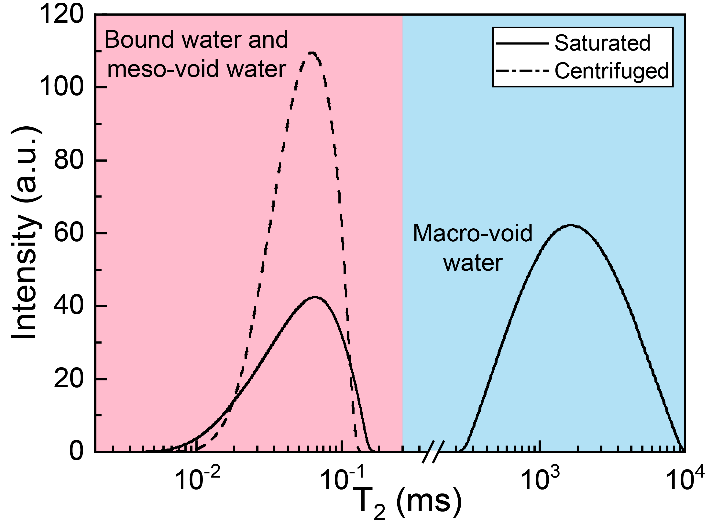
Figure 6 T2 spectra before and after centrifugation for sample C-3
The NMR test results for sample C-3 before and after centrifugation are shown in Figure 6. The two signal peaks measured in the saturated sample correspond to T2 values of approximately 0.08 and 1600. After centrifugation for 2 hours, the cumulative signal intensity of the sample decreased from 2467 to 1689.
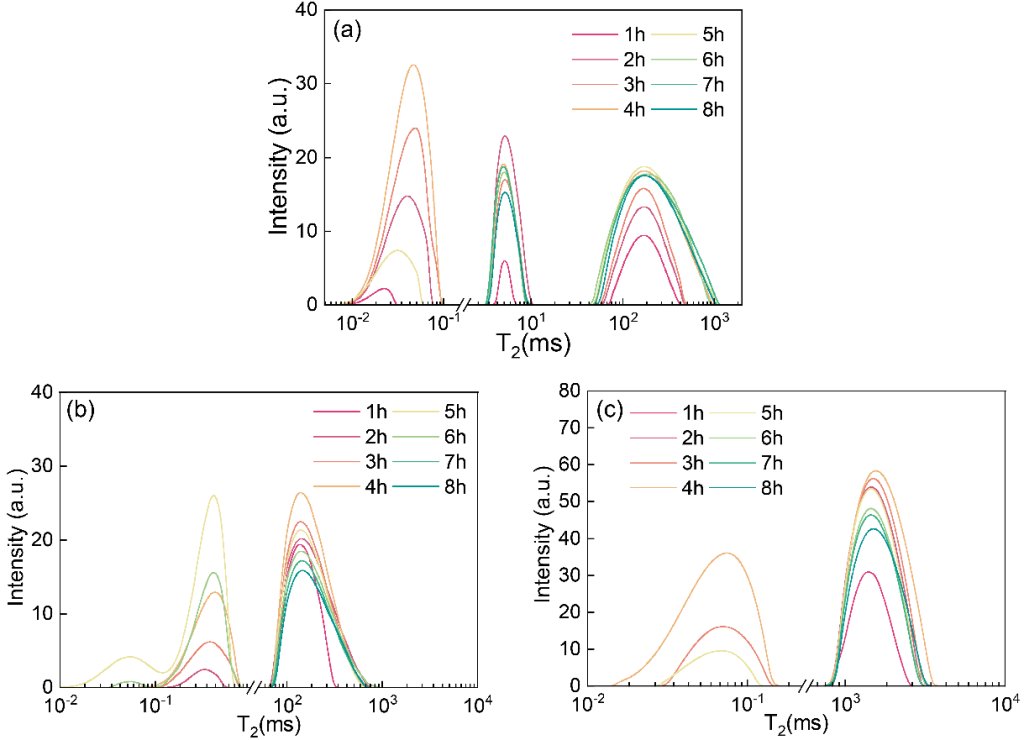
Figure 7 T2 spectra for samples S-1 (a), S-2 (b), and S-3 (c) during the first humidity cycle
Figure 7 shows the hourly NMR test results for the three experimental samples during the first cycle. In the undamaged sample S-1, the T2 spectra show three distinct peaks. The maximum intensity values of these peaks correspond to T2 values of 0.04, 5.35, and 174.26 ms, respectively. Based on the centrifugation test, the left peak is attributed to bound water and water in mesopores. The middle and right peaks originate from free water in smaller and larger macropores. During the 4-hour wetting phase, the middle peak quickly rises to a peak value of 23.0, then drops after two hours. The other two peaks gradually increase throughout the phase. Upon transitioning to the drying phase, all three peaks decrease.
The results of the first cycle show four distinct characteristics:
1. The undamaged sample shows three distinct peaks, two of which correspond to free water in macropores. The two damaged samples, however, do not exhibit the middle peak.
2. As strain increases to 5.70%, the right peak continues to shift to the right, corresponding to a higher relaxation time, from 148.20 ms to 1500 ms. Meanwhile, the left peak remains at approximately 0.05 ms relaxation time for all three samples.
3. During the wetting phase, the right peak continues to rise, reaching its maximum value within four hours. The left peak shows a delayed increase.
4. In the drying phase, the left peak initially continues to rise but rapidly decreases to zero within the following two hours. In contrast, the right peak decreases slowly and continuously, retaining a measurable signal until the end of the cycle.
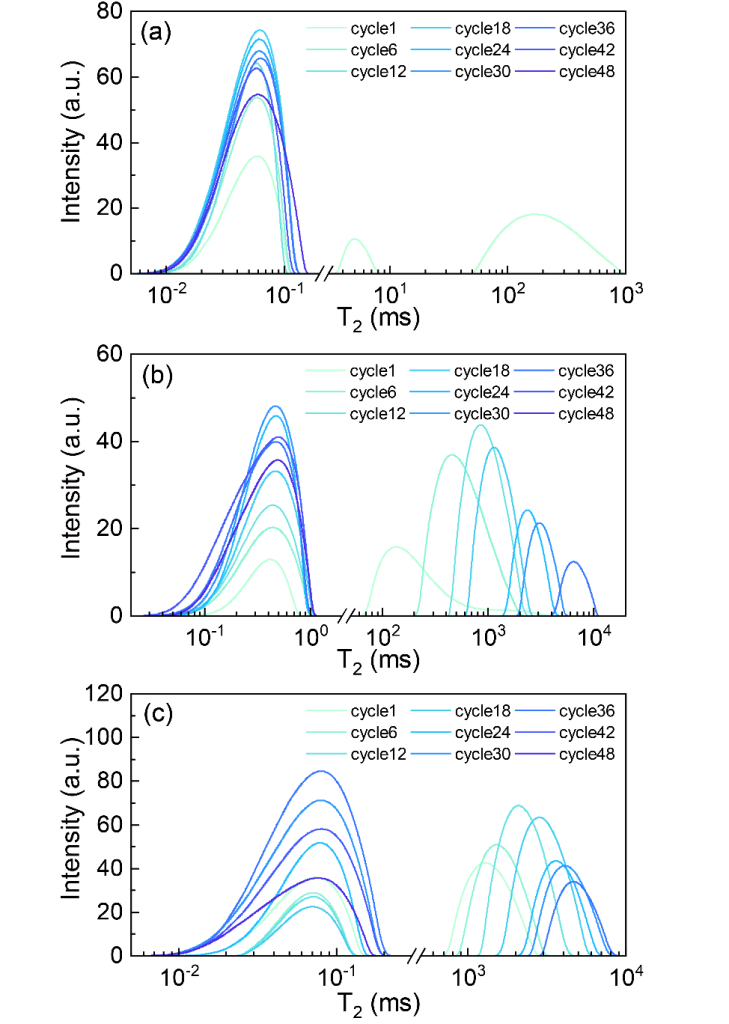
Figure 8 T2 spectra for samples S-1 (a), S-2 (b), and S-3 (c) during the long-term humidity cycling process
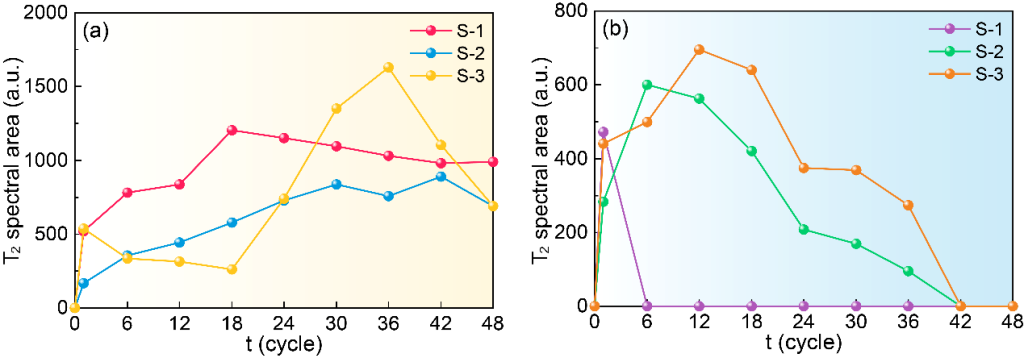
Figure 9 Cumulative T2 spectrum area for left (a) and right (b) peaks for three experimental samples
Figure 9 shows the NMR test results for the three experimental samples conducted over six cycles, with 48-hour intervals, along with the results at the end of the first cycle. However, the T2 spectra measured exhibit changes in shape and height. To visually represent the moisture content in the samples, a plot of the spectral area changes for the left and right peaks is shown in Figure 9.
The T2 spectra from the long-term NMR testing show the following distinct features:
1. Although the T2 values corresponding to the left peak for all three samples remain the same, their shapes differ slightly. In contrast, the right peak for the undamaged sample disappears after six cycles. The right peak for the damaged samples exhibits similar shapes and a clear rightward shift, eventually disappearing before the end of the experiment.
2. The peak areas for all three samples follow a similar trend of increasing and then decreasing. However, the change in the left peak lags behind that of the right peak.
3. In most cases, the area of the right peak is smaller than that of the left peak.
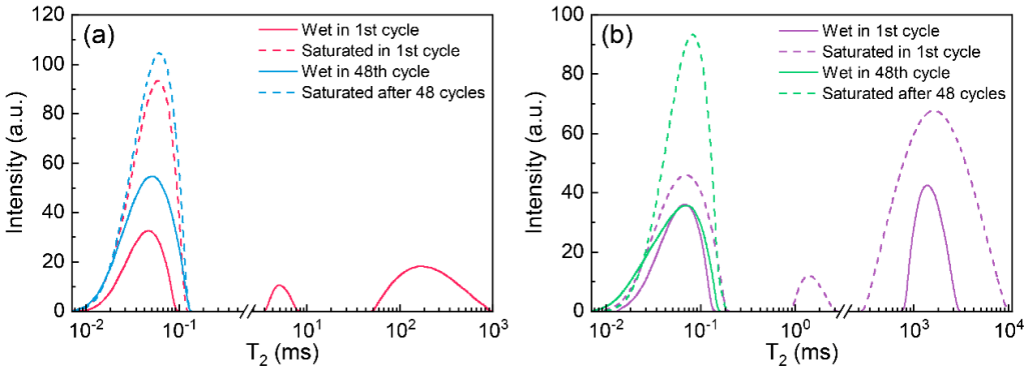
Figure 10 (a) Undamaged sample and (b) sample with strain of 5.70% for NMR results under four conditions, including the results after the first and 48th cycle’s wet phase, saturation results after the first cycle (tested for samples C-1 and C-2), and saturation results after the 48th cycle (tested for samples S-1 and S-3).
Figure 10 compares the T2 spectra of experimental samples under the same level of damage during the first and 48th cycles with saturation results. Since water saturation irreversibly alters the pore structure and internal moisture distribution of the samples, the saturation NMR tests were only performed after the full humidity cycling process to avoid interference with monitoring. Samples C-1 and C-3, which have similar damage levels to S-1 and S-3, were not subjected to humidity cycling, and their saturation results reflect the original pore distribution of these two damaged salt rocks. Although saturation tests were conducted on two different sets of samples, the discreteness of their pore structures may potentially influence the results, but the overall difference in outcomes is valuable for future research.
Through a series of NMR tests, the moisture sorption characteristics of damaged salt rock in a cyclic humidity environment were determined, along with the impact of this behavior on the evolution of the internal pore structure of the rock. Moisture sorption significantly accelerated the self-healing effect of the salt rock, resulting in macropores being filled and segmented within weeks, transforming into mesopores. As a result, the structural integrity of the damaged salt rock was significantly restored. This suggests that the engineering properties of surrounding salt rock in caverns will improve, including permeability and mechanical strength. The absorbed moisture also increases the cohesion of the rock material due to surface tension. Therefore, our study indicates that cyclic humidity environments can accelerate the self-healing mechanisms of surrounding salt rock, reducing the likelihood of gas leakage, cave collapse, and other geotechnical incidents in the surrounding Excavation Damaged Zone (EDZ) during CAES cavern operation.
Salt caverns used for Compressed Air Energy Storage (CAES) are subjected to humidity cycling daily. To evaluate the sealing and stability of CAES salt caverns, it is essential to understand the moisture sorption behavior of damaged salt rock in such environments and its effect on internal pore structure. In this study, we subjected salt rock to humidity cycling after initial damage. Our methodology involved using low-field NMR to study moisture migration and pore structure evolution. The key findings are summarized as follows:
1. There are fluid-accessible pores in the salt rock, including nanoscale mesopores and micron-scale macropores. The scale and volume of the macropores increase with the level of damage.
2. During the wet phase of the first cycle, the water content of both types of pores increased due to moisture absorption. However, the macropores continued to absorb moisture, while the mesopores showed a delayed sorption. When the drying phase began, the moisture in the mesopores quickly decreased to undetectable levels, while the desorption in macropores was relatively slower.
3. For at least the first 12 cycles, the samples remained in a state of sorption. Although the total volume decreased, the average size of the macropores gradually increased during treatment. Before the experiment concluded, the macropores in all three samples were extensively filled, isolated, and transformed into mesopores, ultimately lowering the sample’s porosity.
4. The relatively high viscosity in mesopores was found to slow down moisture sorption during the wet phase and the replenishment of brine during the drying phase at the air-liquid interface. These limitations explain the delayed sorption and desorption phenomena observed in mesopores.
MacroMR12-150H-I Large-Scale NMR Imaging Analyzer
[1] Xu C, Xie R, Guo J, et al. Comprehensive characterization of petrophysical properties in shale by solvent extraction experiments and 2D NMR[J]. Fuel, 2023, 335:127070-.
 Scan QR Code
 Scan QR Code
Phone: 400-060-3233
After-sales: 400-060-3233


Back to Top