
Researchers have adopted a promising drying technique, a combination of freeze-drying and far-infrared drying (FD-FIRD), to dehydrate seed pumpkin (SUP) and evaluated its effects on the physical properties (color, microstructure, texture, shrinkage rate) and bioactive components (phenolics and carotenoids) of the pumpkin. Low-field nuclear magnetic resonance (LF-NMR) was used to analyze the moisture state and distribution during the molding process, which helped to select the appropriate moisture transfer point. Results show that after 25 hours of drying, most of the free water (87.29%) was removed, preserving the sample’s original tissue structure, and minimal deformation occurred during the subsequent heat curing defatting process. Therefore, the sample dried for 25 hours followed by 2 hours of heat curing defatting (FD25-FIRD2) resembled the appearance of the dried defatted sample. FD-FIRD samples had 14.97%–26.60% higher free phenol content than FD samples, depending on the duration of FIRD. In particular, the coumaric acid content in the FD25-FIRD2 sample increased by 32.23%. Additionally, the carotenoid retention in FD-FIRD was 3.00-3.39 times higher than that in FIRD.
Seed pumpkin (Cucurbita maxima Duch.) has been receiving increasing attention due to its rich nutritional value. However, the industrial use of seed pumpkin pulp is still limited. Additionally, fresh seed pumpkin has a high water content, which leads to rapid spoilage and poses challenges for storage and transportation. Previous studies have shown that different drying methods significantly affect the quality of fresh raw materials. Freeze-drying (FD), also known as sublimation drying, removes moisture from the product by sublimating solid ice. Due to the low temperature and low pressure environment, freeze-drying produces high-quality dried products with better appearance and higher nutrient retention compared to other drying methods. However, FD is a time-consuming and labor-intensive process, which limits its application in the food industry. Therefore, it is necessary to reduce the drying time and energy consumption while maintaining the quality of the dried products. In recent years, researchers have combined FD with other drying methods such as hot air drying, far-infrared radiation drying (FIRD), and microwave drying to achieve this goal. Among various combined drying methods, the combination of FD and FIRD (FD-FIRD) has gained increasing attention due to the drying characteristics of FIRD. Therefore, the aim of this study is: (i) to select appropriate moisture transfer points based on the moisture state and distribution in SUP slices; (ii) to investigate the effects of FD-FIRD on the appearance (color, microstructure), physical properties (hardness, shrinkage rate), and bioactive compounds (free phenols, phenolic acids, total carotenoids, and β-carotene) in SUP slices.
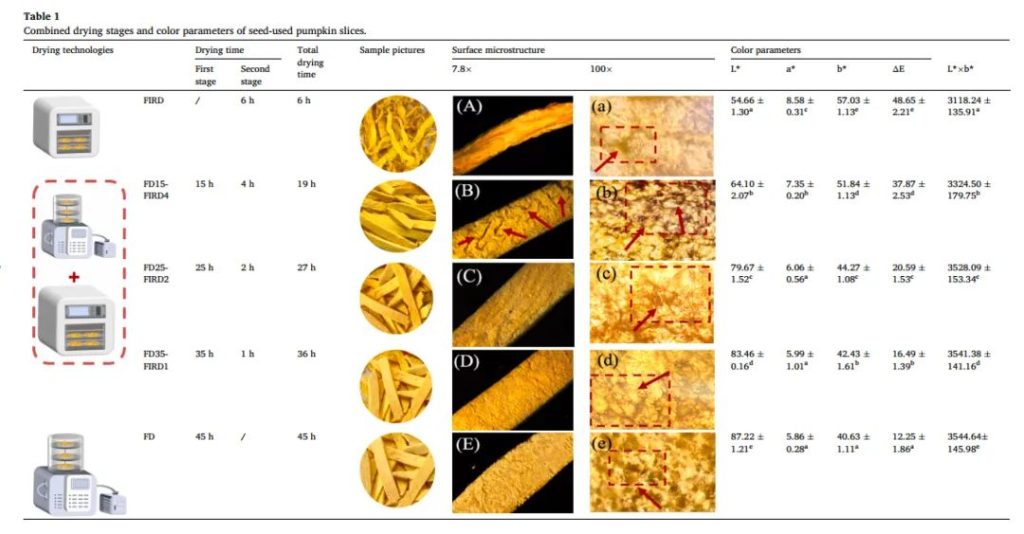
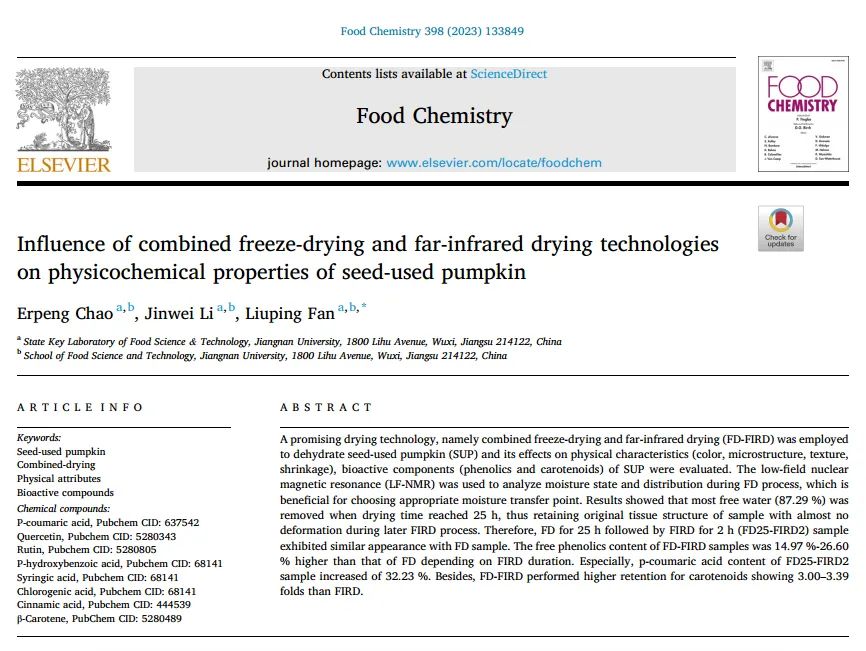
Table 1. Comprehensive drying stages and color parameters of seed pumpkin slices
Table 1 lists the color parameters of SUP slices dehydrated by FD, FIRD, and FD-FIRD. Significant differences were observed in the L*, a*, and b* values of SUP slices dehydrated by different drying techniques (p < 0.05). Compared to other drying methods, the FD samples had the highest L* value (87.22 ± 1.21), which is related to better retention of natural pigments during the FD process. This aligns with our previous study results, where freeze-dried samples had the highest L* value, followed by freeze-dried samples and hot air-dried samples (Chao et al., 2022). Additionally, the L* value of FD-FIRD samples was higher than that of FIRD samples, in the following order: FD35-FIRD1 > FD25-FIRD2 > FD15-FIRD4. Furthermore, hot air-dried SUP slices exhibited the highest a* (8.58 ± 0.31) and b* (57.03 ± 1.12) values, indicating a more reddish and yellowish surface color. The images of the dehydrated SUP samples (Table 1) visually confirm this phenomenon. This could be due to a series of complex Maillard reactions during the heat curing defatting process, as well as changes in the content and configuration of carotenoids. Pumpkin is rich in carotenoids, which are the main reason for the color change during drying.
The microscopic structural differences in the dried SUP slices were further observed using a stereomicroscope (SM) at 7.8x and 100x magnifications. As shown in Table 1A-a, FIRD samples showed cracks, grooves, and rough surfaces. This is because heat treatment promotes tissue decomposition, cell deformation, and the formation of irregular intercellular spaces, i.e., cell wall degradation and cell membrane rupture. Similarly, the FD15-FIRD4 samples also exhibited irregular cracks on their surface (Table 1B-b). This is because after 15 hours of FD, SUP slices still contained a high amount of free water (56.58%), indicating that many ice crystals had not completely sublimated and were still present in the sample, far from the end of the primary drying phase. In this case, the melting of ice during the subsequent FIRD process caused cracking. However, FD25-FIRD2 and FD35-FIRD1 samples showed relatively uniform structures with tightly arranged tissues, resembling the appearance of FD samples. This might be because after 25 hours of drying, most of the free water had been removed, preserving the structural integrity of the sample. In conclusion, FD25-FIRD2 can shorten the drying time by 18 hours while maintaining the good morphology similar to single FD.
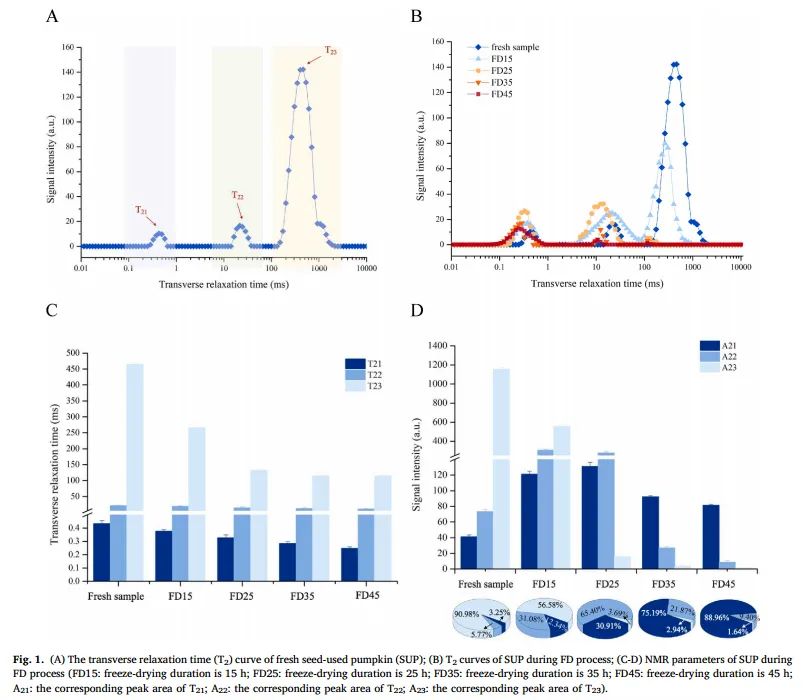
Figure 1. (A) Transverse relaxation time (T2) curve of fresh seed pumpkin (SUP); (B) T2 curve of pumpkin during the freeze-drying process; (C-D) NMR parameters of pumpkin during freeze-drying (FD15: freeze-drying time of 15 hours; FD25: freeze-drying duration of 25 hours; FD35: freeze-drying duration of 35 hours; FD45: freeze-drying duration of 45 hours; A21: peak area corresponding to T21; A22: peak area corresponding to T22; A23: peak area corresponding to T23)
As shown in Figure 1A, the T2 spectrum of fresh SUP has three peaks representing three different moisture states: bound water (T21, in the range of 0.1-1 ms) bound to polysaccharides in the cell wall, immobile water (T22, in the range of 10-100 ms) that is between free and bound water, and free water (T23, in the range of 100-10000 ms) that easily interacts with cytoplasm and extracellular macromolecules, representing weakly bound free water. The total signal amplitude is proportional to the number of hydrogen protons in the SUP sample, so the signal amplitude covered by each peak in the T2 curve represents the relative content of the corresponding moisture state (A21, A22, A23).
From Figures 1B-C, it can be seen that during the entire molding process, with the extension of drying time, the T2 relaxation time and signal amplitude (peak area) of SUP samples generally decrease. The decrease in total peak area is attributed to the reduction in moisture during molding. As shown in Figure 1B, the decrease in A23 indicates that during the primary drying phase, frozen free water is first removed by sublimation from the material. After the primary drying ends, the remaining bound water is removed during desorption drying. Additionally, the T2 inversion spectra tend to shift left along the x-axis (T21: from 0.43 to 0.25; T22: from 21.54 to 10.72; T23: from 464.16 to 114.98). Other studies have also observed a leftward shift in relaxation time during drying. The relaxation time reflects the degree of water binding force and free hydrogen protons in the sample. The shorter the transverse relaxation time (shift left), the smaller the degree of free hydrogen protons and the stronger the water binding force. This is because the reduction in free water leads to an increase in the concentration of macromolecules (such as carbohydrates, proteins, etc.), promoting tighter binding of water to the macromolecules, which reduces the mobility of water.
From Figure 1D, it can be seen that as the drying process progresses, the amplitude of the free water signal A23 gradually decreases, and at the end of drying, its relative content decreases by nearly 90%. When the drying time reaches 15 hours, the proportion of free water is 56.58%. This indicates that when the defatting process lasts for 15 hours, a large amount of ice crystals remain in the sample without fully sublimating, and the sublimation drying process is far from complete. Notably, when the drying time reaches 25 hours, the relative content of free water decreases by 87.29%. This phenomenon is related to the fact that most of the free water in the sample is frozen and can be mostly removed during the sublimation drying phase. At the same time, as the dehydration process progresses, the amount of immobile water (5.77% in the fresh sample) also increases, and when the drying time reaches 25 hours, the immobile water content decreases. This suggests that during drying, free water is continually removed and some of it transitions into immobile water. Meanwhile, the moisture gradient in the sample facilitates the migration of immobile water into bound water. In the later stages of drying (with a drying time of 35 hours), the SUP slices mainly consist of bound water (88.96%), which is tightly bound to proteins and cell wall polysaccharides (cellulose, hemicellulose, and fiber) through strong hydrogen bonds.
Figure 2. Effect of different drying techniques on the hardness and volume shrinkage rate of SUP samples
Shrinkage rate is a common physical phenomenon in dried products and is often used as an important indicator to reveal the final product’s appearance. The volume shrinkage rate of dried SUP slices is shown in Figure 2. Freeze-dried samples had the smallest volume shrinkage rate (5.28 ± 0.52%), meaning their structure was better preserved. In contrast, FIRD samples showed significantly larger volume shrinkage rates (72.77 ± 2.18%). The severe shrinkage caused by FIRD can be attributed to the higher moisture removal rate, which leads to pressure differences inside and outside the dehydrated product. As a result, the entire matrix is pulled towards the center, causing a noticeable shape change (Aprajeeta et al., 2015). Similarly, Nawirska and Biesiada (2009) also found that pumpkin slices dried by freeze-drying exhibited the least drying shrinkage. Compared to freeze-dried samples, convective drying and vacuum drying samples had larger shrinkage rates. As for FD-FIRD samples, FD35-FIRD1 and FD25-FIRD2 had volume shrinkage rates of 6.64 ± 0.68% and 8.79 ± 0.46%, respectively, showing an appearance similar to FD samples. This may be because after 25 hours of defatting, most of the free water (87.29%) was removed, largely preserving the original tissue structure of the SUP slices. As a result, the later samples showed almost no deformation.
Hardness refers to the maximum peak force exerted on a dried product during the first compression. Figure 2 shows the changes in hardness of SUP slices dried using different drying techniques. We noticed that FIRD samples had the highest hardness value, reaching 11333.41 ± 115.90 grams, while FD samples had the lowest hardness value (5093.41 ± 85.90 grams). This may be because the formation of a porous structure during ice crystal sublimation led to a loose, sponge-like texture. Additionally, the changes in fibers and pectin compounds during thermal drying increase the hardness of cell walls, making FIRD samples harder than FD samples. As shown in Table 1A, FIRD samples showed severe shrinkage, and the surface developed a hard texture. Feng et al. (2021) also found that the hardness of dried garlic samples was positively correlated with shrinkage. This suggests that, compared to the loose network structure of FD samples, the severe shrinkage of SUP slices during thermal drying results in a firmer texture. As for FD-FIRD samples, the hardness of FD15-FIRD4, FD25-FIRD2, and FD35-FIRD1 increased significantly (1.46, 1.25, and 1.14 times, respectively) compared to FD. However, this increase in hardness was still much lower than FIRD. Since FD-FIRD products have appropriate hardness, they are more convenient for transportation.
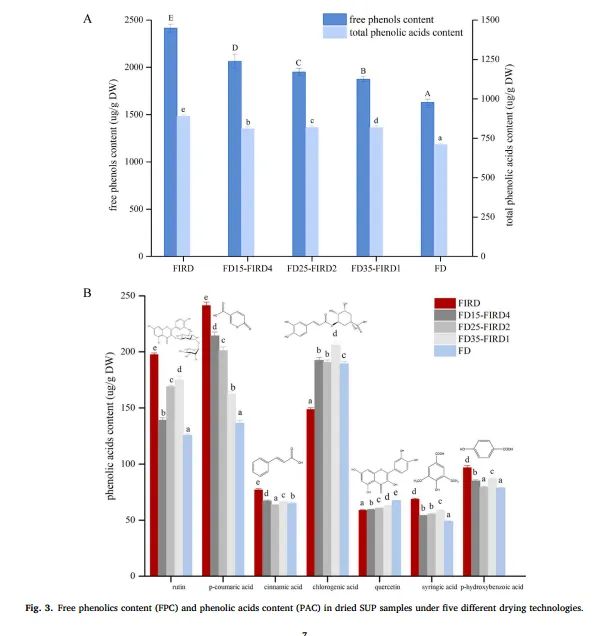
Figure 3. Free phenol content (FPC) and phenolic acid content (PAC) of dried SUP samples under five different drying techniques
Phenolic compounds are major components of various biological functions, including antioxidant, antibacterial, anti-tyrosinase, anti-inflammatory, and anti-tumor activities. Figure 3 shows the changes in free phenol content (FPC) and phenolic acid content (PAC) of SUP slices after drying using different techniques. FIRD samples had significantly higher free phenol and phenolic acid content (2413.42 ± 42.56 μg/g DW and 889.66 ± 9.27 μg/g DW, respectively), while FD samples had relatively lower free phenol and phenolic acid content (1629.79 ± 32.95 μg/g DW and 710.18 ± 8.93 μg/g DW). The marked increase in free phenols and phenolic acids in FIRD samples may be due to FIR radiation converting molecular vibrations into heat, which is rapidly absorbed by the center of the sample (Ratseewo et al., 2020). This drying process releases bound phenols associated with structural components (such as cellulose, hemicellulose, lignin, structural proteins, and carbohydrates) and activates small molecule phenolic compounds, thus leading to an increase in free phenols and phenolic acids in dried SUP (Ratseewo et al., 2020). Most notably, FD25-FIRD2 showed higher free phenol content, with an increase of 19.65% compared to FD (Figure 3A). This phenomenon is likely due to the formation of ice crystals during the freeze-drying process, which leads to cell membrane rupture and loosening of the cell wall pectin network, improving the extraction efficiency of polyphenolic substances. Furthermore, the subsequent FIRD process further inhibited the enzyme-induced degradation, resulting in an increase in free phenols. Compared to the exposure time (2 hours) of FD25-FIRD2, the longer FIR exposure time (4 hours) in FD15-FIRD4 significantly increased free phenols.
Seven phenolic acids were identified in the FD, FIRD, and FD-FIRD products: coumaric acid, chlorogenic acid, p-hydroxybenzoic acid, rutin, ferulic acid, cinnamic acid, and quercetin (Figure 3B). Coumaric acid was the most prominent phenolic acid detected in all dried SUP samples, with the highest content in FIRD samples (241.50 ± 0.88 μg/g DW). Notably, the coumaric acid content appeared to correlate positively with the FIR exposure time: FD15-FIRD4 (4 hours) had 214.27 ± 0.45 μg/g DW, and FD35-FIRD1 (1 hour) had 162.28 ± 0.43 μg/g DW. One reason is that FIR can induce ester bond cleavage between coumaric acid and hemicellulose. Another reason is that coumaric acid has good thermal stability. Additionally, FD35-FIRD1 had the highest chlorogenic acid content (206.13 ± 3.61 μg/g DW), which is related to the reduction in oxidation reactions caused by oxygen during the defatting process. According to previous studies, due to the presence of easily oxidized and unstable ester bonds and unsaturated double bonds, high drying temperatures and oxygen-rich environments may induce the isomerization of chlorogenic acid. Meanwhile, quercetin content in FD samples was 1.14 times higher than that in FIRD samples. Interestingly, the rutin content in FD15-FIRD4 was significantly reduced by 72% compared to FIRD samples, followed by FD25-FIRD2 (61%) and FD35-FIRD1 (55%). This change in rutin content may be due to the residual water content at the end of the defatting process. Ranieri et al. (2019) also found that the residual water content at the end of the dehydration process affects the changes in rutin content during the subsequent drying process, with higher residual moisture leading to rutin loss. As mentioned above, the phenolic acid content was influenced by different drying techniques, which could be due to changes in the interactions between phenolic acids and other compounds (such as pectin, cellulose, and proteins) or changes in the structure of phenolic acids. Furthermore, FD-FIRD is a viable alternative method for preserving phenolic compounds in SUP, and it may even outperform FIRD.
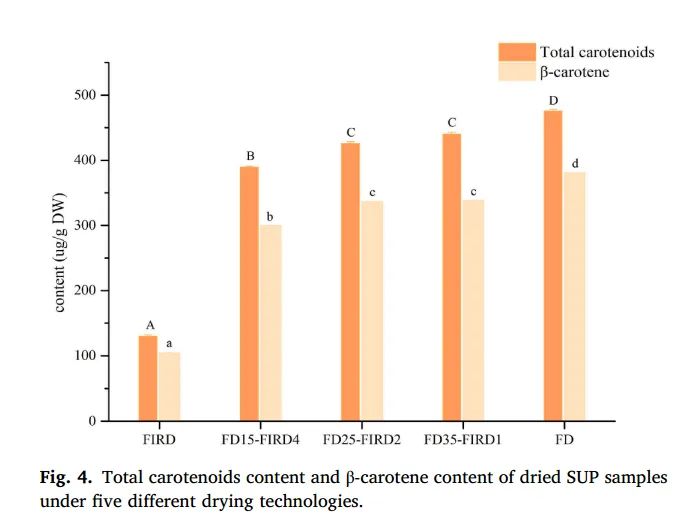
Figure 4. Total carotenoid content and β-carotene content of dried SUP samples under five different drying techniques
Consuming foods rich in carotenoids has many health benefits, such as anti-inflammatory, chronic disease prevention, anti-aging, etc. (Mapelli Brahm et al., 2020). Figure 4 shows the changes in carotenoid content in SUP slices dried using different techniques. The results indicate that FD samples had the highest carotenoid and β-carotene content (475.68 ± 2.49 μg/g DW and 380.54 ± 0.46 μg/g DW, respectively) compared to other drying methods. Ye et al. (2019) also reported similar results, stating that freeze-drying protects carotenoids from the effects of light, high temperatures, and oxygen. In general, hot drying causes more severe carotenoid loss than non-thermal drying. The largest decrease in carotenoid content occurred in hot air drying. Previous studies have also proven that both hot air drying and cold air drying are detrimental to preserving β-carotene content. This is mainly because the presence of oxygen triggers the degradation of carotenoids. Additionally, Beta and Hwang (2018) also demonstrated that the original trans-structure of carotenoids is converted to the cis-structure when exposed to heat. Carotenoid and β-carotene content in FD25-FIRD2 were much higher, 3.28 and 3.23 times higher than in single FIRD, respectively. Furthermore, carotenoid and β-carotene content were closely related to the duration of FIRD exposure, indicating that longer exposure to FIRD leads to a decrease in carotenoid and β-carotene content. This may be because, during freeze-drying, ice crystals occupy the cavities in the sample, forming a porous structure. Harnkarnsujarit and Charoenrein (2011) found that the presence of a porous structure is conducive to the retention of oxygenated carbon.
To complement the advantages of single FD and FIRD, the FD-FIRD technique was used to dehydrate SUP pulp. The results show that the combined drying transition point has a significant impact on the final product’s physical properties (color, microstructure, texture, shrinkage rate) and bioactive components (phenolics and carotenoids). LFNMR analysis of moisture state and distribution during the dehydration process helped to select the appropriate combined drying transition point. LFNMR results indicated that after 25 hours of drying, most of the free water (87.29%) was removed, preserving the original tissue structure of the pulp. On this basis, further drying using FIRD resulted in high-quality products (FD25-FIRD2). The appearance of the FD25-FIRD2 sample was similar to that of the single FD sample dried for 45 hours, indicating that the FD25-FIRD2 method significantly shortened the FD time. Furthermore, FD-FIRD samples had 14.97%–26.60% higher free phenol content than single FD samples. In particular, the coumaric acid content in the FD25-FIRD2 sample increased by 32.23%. Additionally, FD-FIRD samples had carotenoid retention rates 3.00-3.39 times higher than those in FIRD. In conclusion, the FD25-FIRD2 method can reduce energy consumption while ensuring good physicochemical quality of the final product.
Article reprinted from: Zhejiang University of Technology Food Nutrition and Health Lab
 Scan QR Code
 Scan QR Code
Phone: 400-060-3233
After-sales: 400-060-3233


Back to Top