

This study explores the forms of water in stored grains, particularly the interactions between water droplets and particles in “inverse emulsion drilling fluids.” Oil-based drilling fluids are typically viewed as a mixture of water-in-oil (W/O) emulsions and inorganic hydrophilic particles (such as barite and clay). However, the interaction between water droplets and inorganic hydrophilic particles has not been sufficiently considered. This study investigates the presence of water in the oil phase by adding hydrophilic BaSO₄ particles and hydrophobic PTFE particles to water-in-oil (W/O) emulsions.
The experimental results show that hydrophilic BaSO₄ particles can bind with water droplets, forming hydrated particle aggregates, while hydrophobic PTFE particles do not. Furthermore, the actual presence of water in oil-based drilling fluids was confirmed through 2D T₁-T₂ NMR technology. The study found that oil-based drilling fluid is not just a W/O emulsion, but a colloidal dispersion system of particles with bound water in the oil phase. This discovery provides a scientific basis for the design of next-generation oil-based drilling fluids.
Food security is crucial for promoting economic growth, improving living standards, maintaining social stability, and ensuring national security. Storage is an indispensable stage before food consumption and processing. Grain storage can be viewed as an ecosystem involving many abiotic factors (such as temperature, moisture, humidity, and microflows) and biotic factors (such as fungi, insects, mites, and grains). The complex interactions between coexisting abiotic and biotic fields significantly affect the stability of the grain storage ecosystem, potentially leading to substantial losses in both food quality and quantity. Therefore, systematically monitoring these fields and further studying the underlying mechanisms behind nonlinear phenomena, such as fungal growth, moisture condensation, and grain sprouting, caused by these interactions is essential to ensure food security. Currently, methods for studying moisture fields in grain storage piles rely on manual sampling, moisture sensors, and numerical models, but these methods have their limitations. To better monitor moisture in grains, some researchers have proposed electromagnetic imaging systems, radio tomography imaging systems, and have reported using RF, microwave, and near-infrared spectroscopy to enhance the accuracy and stability of moisture sensors. However, to date, there is no system or equipment based on Low Field NMR (LF-NMR) technology that simultaneously detects the temperature, moisture, and humidity in stored grains. This study aims to: (1) propose a novel graphical detection system based on LF-NMR to explore the multi-field interactions inside stored grains; (2) design the structure of the system and develop its data collection and image generation software; (3) evaluate the feasibility of the system by conducting two small-scale storage experiments using rice samples.
1. Components of the graphical detection system:
LF-NMR Imaging Analyzer: Suzhou Newmai Analytical Instrument Co., Ltd., Model: MesoMR12-060H-I, consists of a permanent magnet (field strength 0.35T), probe coil, probe stand, two control cabinets, and a monitor. The probe coil is a key component for data collection, with a diameter of 150mm and a penetration depth of 120mm. Proton density data from different cross-sections of the grain sample placed in the coil can be measured by adjusting imaging parameters.
Grain Container: A small grain container that fits into the probe coil, made of PTFE material for the main body and cover to avoid affecting the accuracy of the LF-NMR imaging analyzer data. The container’s body has a diameter of 148mm, height of 184mm, and wall thickness of 4mm.
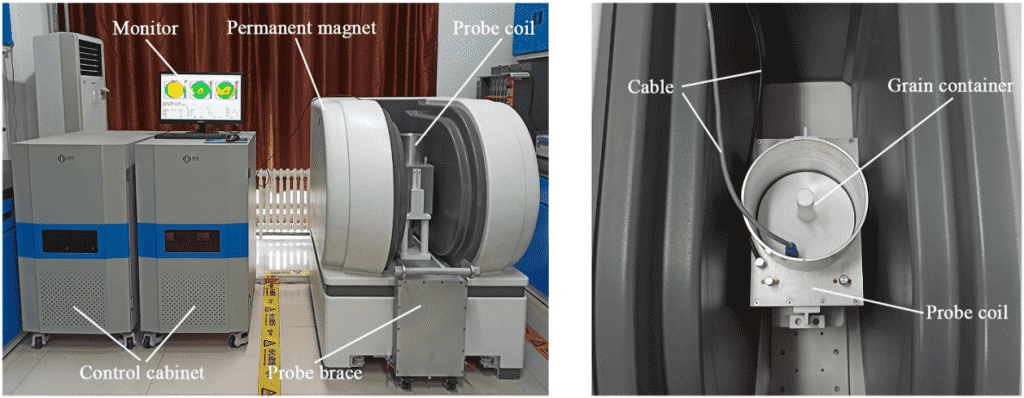
Figure 1: Appearance structure of the NMR system and the grain container
Data collection and image generation software: Python (version 3.9.12) was used to develop data collection and image creation software, which processes measurement data and visualizes the results as cloud maps. The software interface consists of a display area and parameter settings area. The display area can simultaneously show cloud maps of temperature, moisture, and humidity for the top, front, or left view of a grain sample’s cross-section. It can also display raw temperature data in table form.
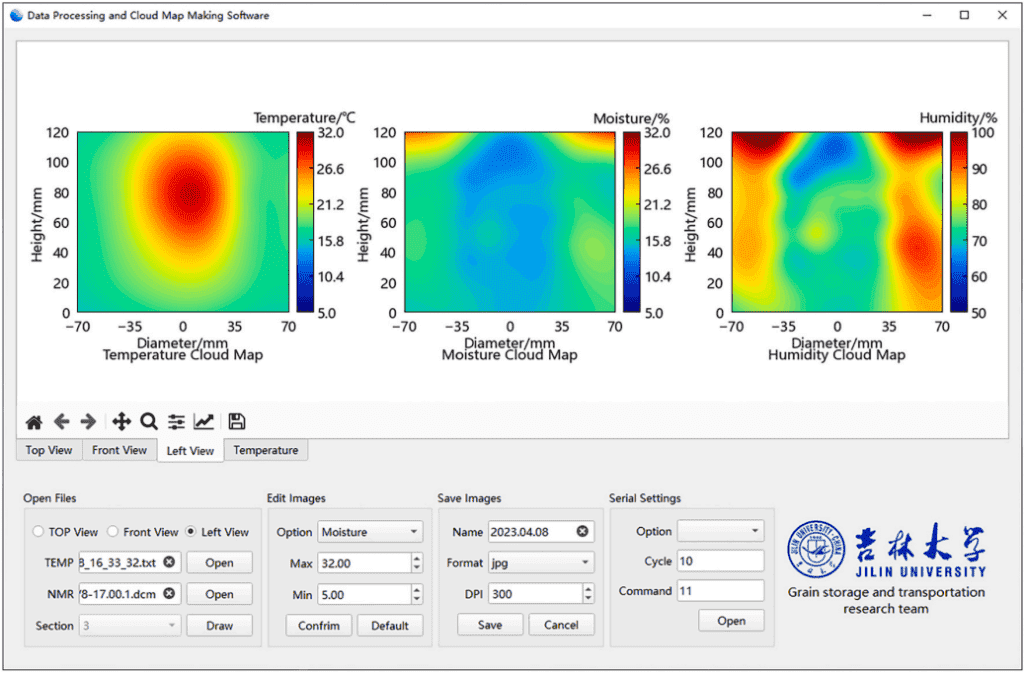
Figure 2: Interface of the data collection and image creation software
To evaluate the feasibility of monitoring grain storage temperature, moisture, and humidity fields with the graphical detection system, two small-scale storage experiments were designed using rice samples. Each experiment lasted 15 days, with temperature data and proton density data collected every 24 hours.
Experiment 1: Hotspot and high moisture 1415 zone: A mixed grain sample consisting of rice with two different initial MC (18.3% (w.b.) and 31.9% (w.b.)) was used. The total height and diameter of the mixed grain sample were 120mm and 140mm, respectively. The high-moisture rice zone was cylindrical, with a diameter of 60mm and a height of 50mm, located at the horizontal center of the grain container, 39mm from the container’s bottom. The remaining space was filled with low-moisture rice. A constant-temperature heater of size 12mm×8mm×3mm was placed at the center of the high-moisture region to generate a local hotspot. The heater’s rated power and temperature were 4W and 50°C, respectively, with the actual surface temperature around 40°C. The heater remained on during the experiment except for the time used for proton density data collection.
Experiment 2: Only the hotspot: Rice with an MC of 18.3% (w.b.) was used, and the rice was poured into the grain container with a height of 120mm and a diameter of 140mm. The heater was placed at the center of the rice sample to create a local hotspot. All other procedures were the same as in Experiment 1.
Experiment 1:
Temperature field variation:
Figure 3 shows that the initial temperature is almost uniformly distributed at approximately 16°C. Subsequently, due to the heating from the constant-temperature heater, the center temperature began to rise, reaching 28.8°C on Day 1, while the area near the inner wall remained at 15.6°C. Driven by the temperature gradient, heat diffused outward, creating a localized high-temperature region at the top of the sample. During the early stages of storage, the size and center temperature of this region gradually increased. From Day 0 to Day 7, the area expanded from 0cm² to 50.96cm², and the center temperature rose from 16.8°C to 32.7°C. In the later stages, the area and center temperature decreased over time, dropping to 33.42cm² and 30.2°C on Day 14. This is likely because the high moisture content of the rice in the initial stage provided good thermal properties (specific heat and thermal conductivity), enhancing the heat storage and transfer capacity, leading to heat accumulation and expansion of the high-temperature region. As the rice gradually dried out, the situation reversed. Moreover, the micro-airflow inside the grain container also helped reduce the high-temperature region through heat transfer.
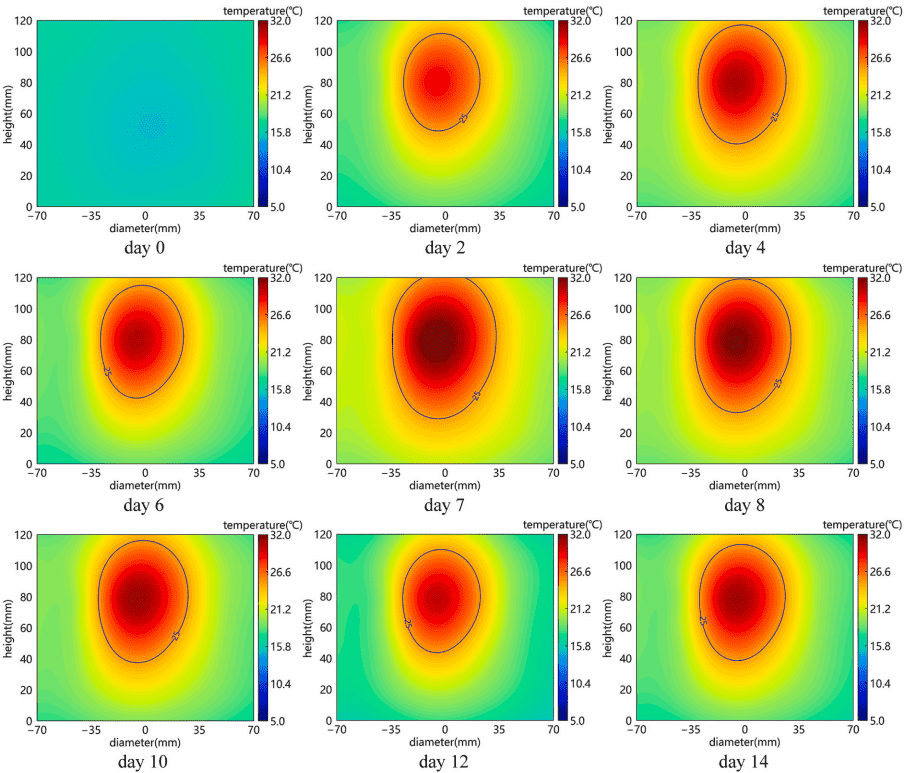
Figure 3: Temperature changes in V2 section of Experiment 1 over different storage days
Moisture field variation:
Figure 4 shows the moisture migration in the mixed sample V2 cross-section over different storage days. Upon loading the sample, a distinct high-moisture region appeared in the center, with an area of 37.07 cm² and a maximum moisture content (wet basis) of 33.5%. This region had an irregular shape, likely due to uneven moisture distribution in the high-moisture rice. Under the heating of the constant-temperature heater, this region gradually dried, and both its area and moisture content decreased over time. By Day 4, the region nearly disappeared, with the area shrinking to 9.03 cm² and the maximum moisture content dropping to 22.4% (wet basis), temporarily making the moisture distribution in the entire cross-section uniform. On Day 6, two new high-moisture regions appeared in the left and right upper sections, while the central region had completely disappeared. These new regions had a maximum moisture content of 39.0% (wet basis), 6% higher than the initial state. This phenomenon is likely caused by the micro-airflow carrying water vapor upwards. When the micro-airflow meets the colder upper air layer and container wall, its temperature drops, and the relative humidity approaches saturation. As a result, the rice near the surface and wall starts absorbing moisture from the air, increasing its moisture content. By Day 14, the total area of these two regions had grown to 15.40 cm², and the maximum moisture content reached 40.2% (wet basis), indicating the possible deposition of free water.

Figure 4: Changes in moisture in V2 section of Experiment 1 over different storage days
Humidity field variation:
Figure 5 shows the diffusion of humidity in the mixed sample V2 cross-section over different storage days. In the initial state, most of the central cross-section was occupied by a high-humidity region with an area of 49.20 cm² and a maximum relative humidity (RH) of 100%. As the temperature of the high-temperature region increased, the RH within the high-humidity region began to decrease to maintain thermodynamic equilibrium. Meanwhile, the high-moisture rice gradually dried, and its moisture evaporated into the gap air. Under the influence of micro-airflow, water vapor diffused outward, increasing the RH across the entire cross-section. By Day 5, the high-humidity region expanded to its maximum area of 94.22 cm², and the minimum RH of the cross-section increased from 62.4% to 69.6%, while the maximum RH dropped to 98.4%. As these processes continued, water vapor was carried to the colder outer regions near the walls and surfaces, accumulating and causing the RH in these areas to rise. Eventually, two narrow high-humidity zones formed on both sides of the cross-section. At the end of storage, the area of the high-humidity region shrank to 79.33 cm².

Figure 5: Changes in humidity in V2 section of Experiment 1 over different storage days
This study introduces the first graphical detection system based on Low Field Nuclear Magnetic Resonance (LF-NMR) to explore multi-field interactions in grain storage. From the cloud maps in Figures 3, 4, and 5, the physical interactions between temperature, moisture, and humidity fields can be directly observed. In summary, during the interaction process, temperature serves as the driving force, promoting moisture evaporation and triggering micro-airflows. The micro-airflow, as a carrier, assists the diffusion of water vapor and moisture migration, affecting temperature distribution. For grain sprouting, the temperature must be above 4°C, and the moisture content must be between 15% and 45%. Similarly, fungal growth requires temperatures above 20°C, moisture content above 13.5% (wet basis), and relative humidity above 75%. Analyzing the cloud maps, it was found that although the temperature in the central region remained above 25°C throughout the storage period, the moisture content and relative humidity in this region decreased over time. In contrast, the moisture content and relative humidity in the left and right upper cross-sections continued to increase, and the temperature remained around 20°C. Therefore, despite the lower temperature, these areas are more conducive to fungal growth and grain sprouting compared to the central region.
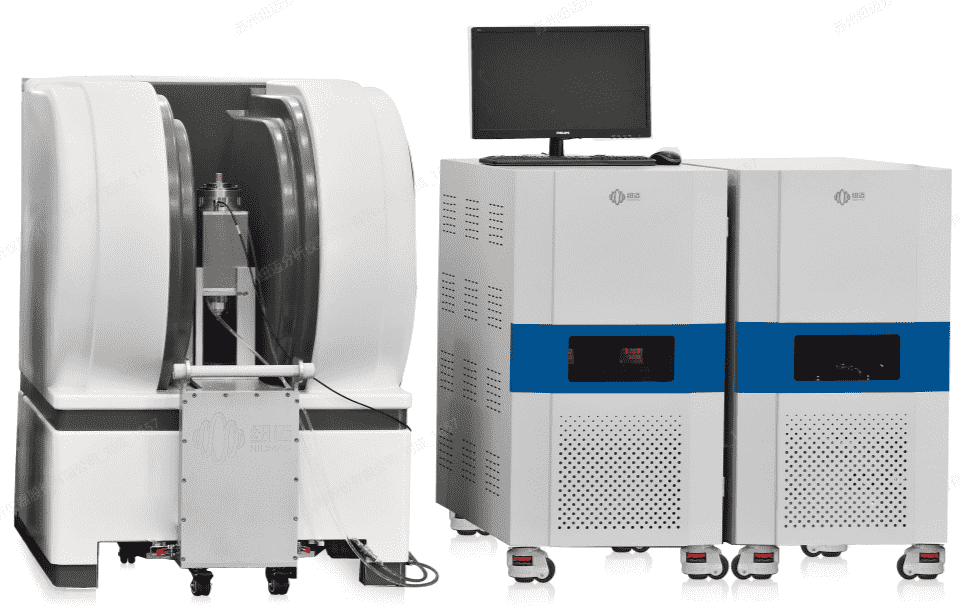
Large Size Nuclear Magnetic Resonance Imaging Analyzer
If you are interested in the applications above, feel free to contact us:18516712219
References
[1] Zhang J, Wu W, Liu Z, et al. Development and verification of a graphical detection system for multi-field interactions in stored grain based on LF-NMR[J]. Biosystems Engineering, 2024:241.
DOI:10.1016/j.biosystemseng.2024.03.005.
 Scan QR Code
 Scan QR Code
Phone: 400-060-3233
After-sales: 400-060-3233


Back to Top