
The influence of aggregate size (AS) on the hydration performance of cement mortar is crucial for improving the quality and stability of the material. This study aims to explore the impact of AS on water distribution, hydration, and pore structure characteristics during the early hydration process of cement mortar using low-field Nuclear Magnetic Resonance (NMR) technology. Through T2 spectra, the degree of hydration and fractal dimension were calculated, and a model of water distribution at different times and locations during the hydration process was established based on MRI bitmap data. The changes in water content at various positions were also studied. The results indicate that during hydration, part of the water is consumed by the hydration reaction, while some water seeps out, becoming bleed water. Water in large pores flows toward smaller pores under hydrostatic pressure. AS affects the uniformity of the cement mortar’s initial state, with graded sand improving uniformity. The smaller the AS, the more complex the distribution and changes in pore water during hydration. The volume of seepage water is proportional to porosity and inversely proportional to the specific surface area of particles. Moreover, porosity plays a more significant role in seepage water than AS. The fractal dimension of pores is negatively correlated with AS. The more complex the aggregate composition, the more intricate the fractal dimension changes in the initial stage. The fractal dimension increases with hydration time, while gel pores (G) do not exhibit fractal characteristics. Capillary pores (C) and transition pores (T) begin to show fractal characteristics after a certain period of hydration, while air pores (A), though fractal, do not exhibit continuity.
Concrete, as a vital construction material, has always been a focus of research. Cement mortar, a typical cement-based composite material, is primarily composed of aggregates, paste, and interfacial transition zones (ITZs). ITZs exist on the surface of aggregates, and their content is related to the surface-to-volume ratio (SVR) of the aggregates. ITZs cause the porosity near the aggregate surface to be significantly higher than in the cement matrix. The SVR affects the pore size and connectivity of the mortar. As the SVR decreases, the porosity increases, the alkali release potential rises, and the alkali content in pore fluids increases. When the SVR increases, the average pore diameter becomes smaller, the mortar becomes denser and more uniform, and the porosity fraction increases. Therefore, the uniformity and density of the sample can be improved by optimizing the AS distribution. Furthermore, the irregularity of the aggregate significantly impacts crack initiation and propagation. The greater the sphericity of the aggregate, the more evenly the pores filled by the aggregate are distributed. During the pouring process, the aggregate content, uncompressed voids, and size significantly affect the flowability of the concrete. Optimal aggregates can promote the flowability and uniformity of the paste. In conclusion, the performance of concrete or cement mortar is significantly influenced by the aggregate.
The experimental materials used were standard sand (B) and machine-made sand as aggregates, along with white Portland cement. The equipment used was a low-field NMR device, manufactured by Suzhou Niumag Analytical Instruments Co., Ltd., model: MacroMR-150H-I.
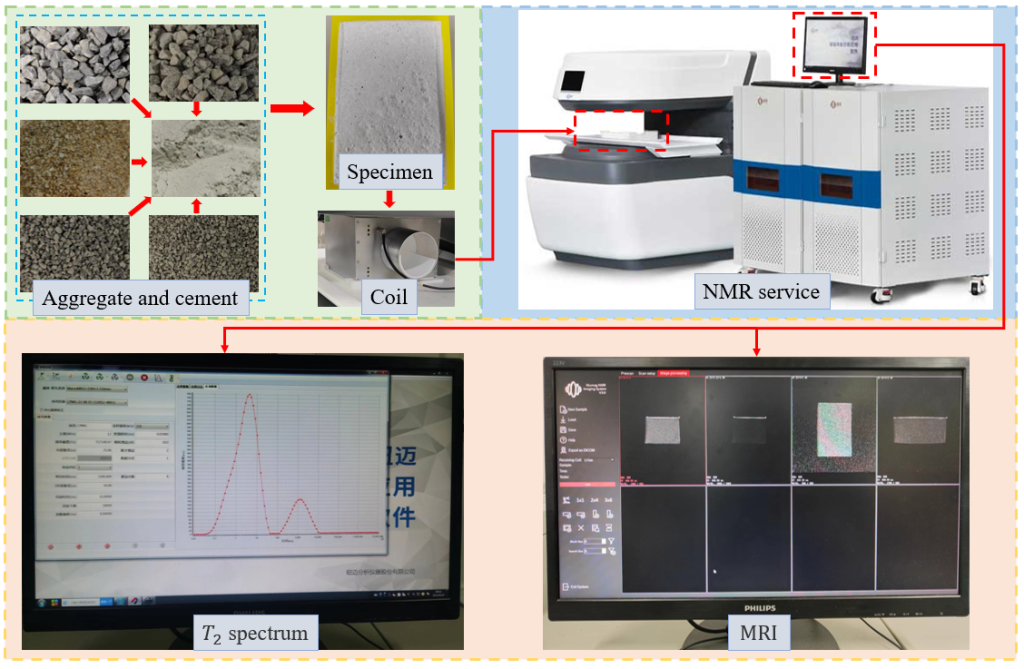
Figure 1: Schematic of the test process and experimental setup
The experimental process is briefly described in Figure 1, outlining the sample preparation and real-time NMR testing process:
(1) The samples were mixed in a 2:1.45 (aggregate: ordinary white Portland cement: water) ratio. The aggregates included standard sand (B) and machine-made sand: the primary component of the machine-made sand is limestone, with particle sizes of 0.63-1.25 mm, 1.25-2.5 mm, 2.5-5 mm, and greater than 5 mm (W0.63, W1.25, W2.5, W5); standard sand followed China’s ISO standard sand. Prior to the test, the sand was cleaned with fresh water to remove dust and impurities.
(2) The molds were 3D printed from polylactic acid (PLA) material, with dimensions of 100mm×69mm×54mm.
(3) The cement mortar was mixed on-site beside the NMR device, placed into the molds, compacted, weighed immediately, and then placed into the NMR device for T2 spectra and MRI testing.
(4) After testing, the samples were cured indoors at 25°C.
(5) The NMR testing method was as follows: for the first 3 hours, measurements were taken every 0.5 hours; from 4-6 hours, measurements were taken every hour; from 7-12 hours, every 2 hours; and at 24 hours, 48 hours, 72 hours, and 7 days, one measurement was taken each time. Weight was recorded before each test.
T2 spectrum peak area is positively correlated with sample water content. Without considering the closed pores in the sample, the water volume of the pressure-saturated sample corresponds to the pore volume. By conducting NMR tests on samples with known water content or porosity, a linear relationship between peak area and porosity can be obtained (as shown in Figure 2).
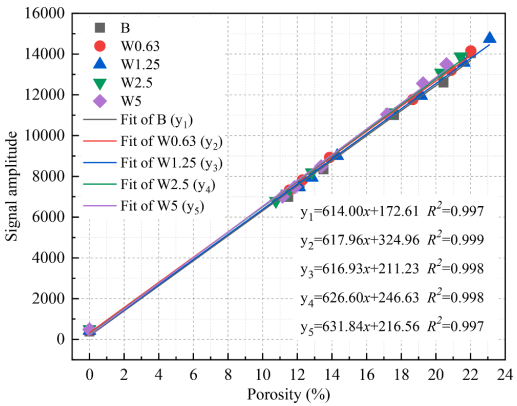
Figure 2: Relationship between sample porosity and T2 spectrum signal strength (peak area)
Figure 3 shows the changes in the T2 spectrum during hydration. Within the first 5 hours, all T2 spectrum peaks shifted left, with the changes in capillary pores and pores being the most noticeable. The peak area of transition pores continuously decreased, while the peak area of gel pores gradually increased. After 10 hours, the relaxation time of all pores became less than 10 ms. The peak areas of gel and transition pores significantly increased, while air and capillary pores disappeared. After 24 hours, the relaxation time and peak area stabilized and remained unchanged.
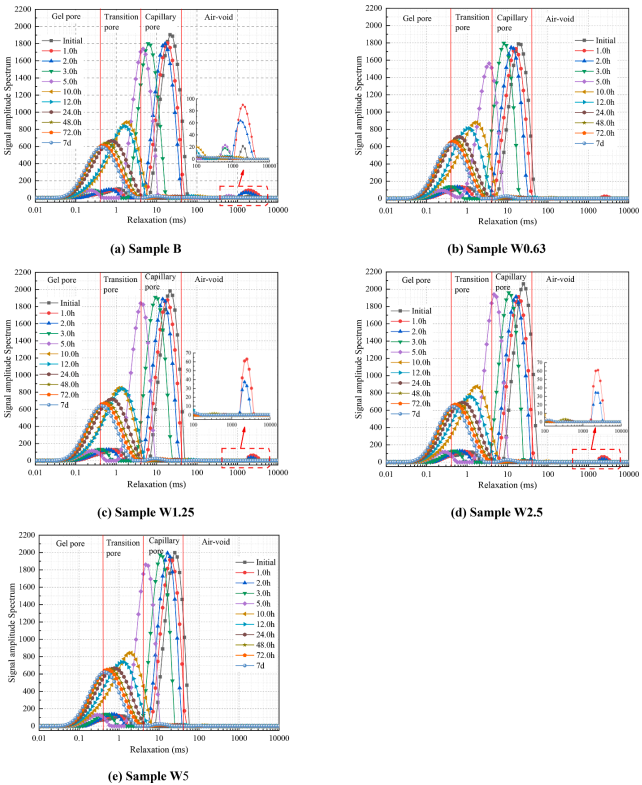
Figure 3: Changes in T2 spectrum during hydration
Figure 4 shows the changes in porosity ratio during hydration. The most noticeable changes in porosity ratios occur in transition pores, capillary pores, and gel pores. Capillary and air pores decreased rapidly, while transition pores increased initially and then decreased after reaching a certain proportion, stabilizing afterward. The proportion of gel pores gradually increased before stabilizing.
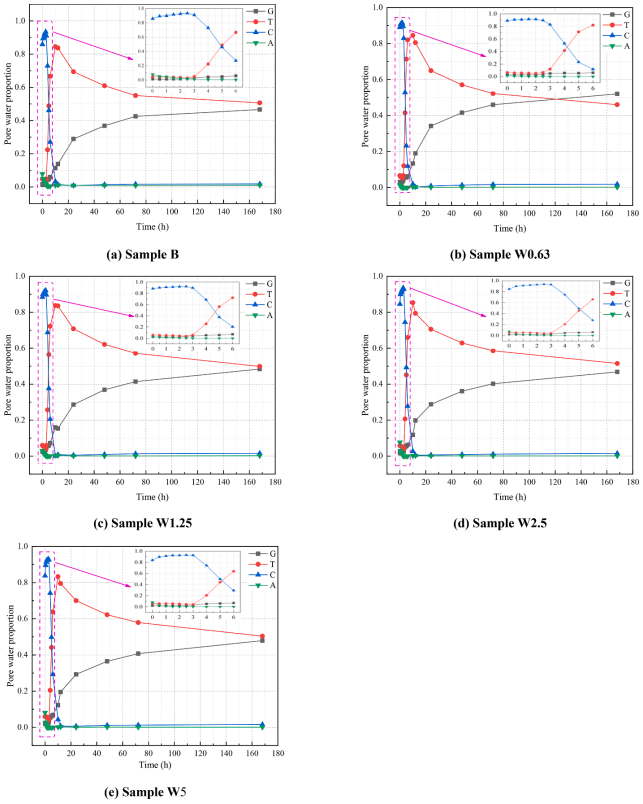
Figure 4: Changes in porosity ratio during hydration
Figure 5 shows the changes in evaporated water, physically bound water, and NMR signal strength during hydration. As hydration time increases, peak area and physically bound water decrease, while evaporated water mass increases. The rate of change in these factors is most prominent during the first 24 hours, after which the rate of change slows down. The rapid change in evaporated water in the early stages is primarily due to a large amount of bleed water covering the sample’s surface, and as hydration continues and water content decreases, the evaporated water mass stabilizes.
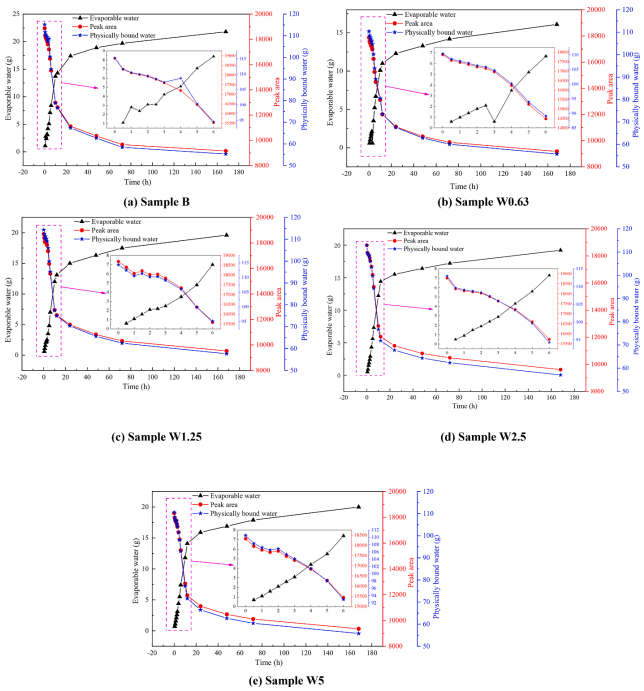
Figure 5: Changes in evaporated water, physically bound water, and peak area during hydration
Figure 6 shows the water distribution in the sample during the early hydration process, calculated from MRI bitmap data. The color depth of MRI reflects the water content, and MRI bitmap data quantifies the color depth at corresponding positions, making it positively correlated with water content. MRI bitmap data can be used to calculate the water content at different positions and times. The water content at the top of the sample (0-3.0mm) is much higher than other positions, and this water is considered bleed water. During hydration, water distribution at different depths in W5 changes little during the first 3 hours, and water content decreases and stabilizes with depth. However, at the bottom, a sudden change occurs (initial rapid decrease followed by a rapid increase). With increasing depth, the water content in W0.63, W1.25, and W2.5 samples decreases initially, stabilizes at a certain depth, and then decreases further.
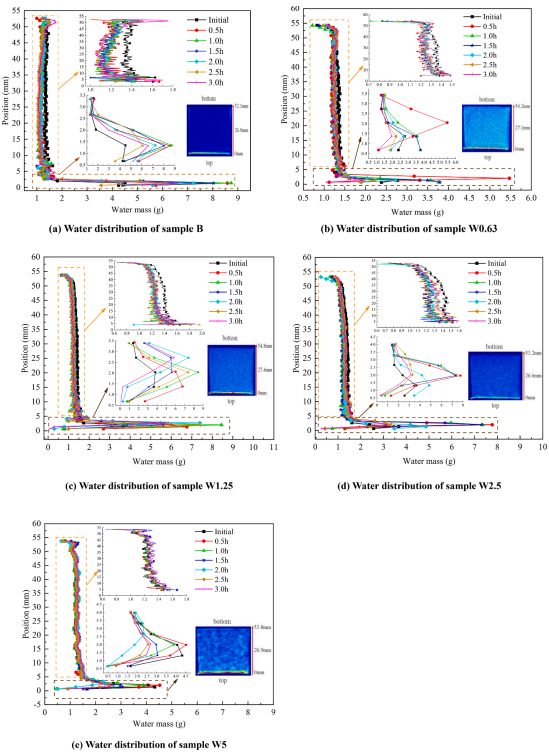
Figure 6: Water distribution during early hydration in the sample, calculated from MRI bitmap data
Figure 7 shows the fractal dimension changes of transition pores, capillary pores, and air pores during the hydration process. For the first 10 hours of hydration, transition pores remain unstable, with their fractal dimensions fluctuating between fractal and non-fractal states. The fractal dimension of transition pores changes in a U-shaped pattern during the first 3 hours, with the sequence of W0.63, W1.25, B, W5, and W2.5 from largest to smallest. Between 3-6 hours, free water in gel pores is consumed by the hydration reaction, and under hydrostatic pressure, free water from transition pores is transferred into gel pores, resulting in a sharp decrease in the fractal dimension. After 6 hours, as the hydration reaction continues to consume free water, hydrostatic pressure in the pores increases, causing capillary water to flow back and intensifying hydration, leading to an increase in the fractal dimension. In summary, the effect of AS on the hydration process of transition pores is primarily due to the spatial arrangement of different particle sizes of aggregates, which affects the distribution of the cement paste’s pore structure, leading to changes in hydration degree and rate, and complex variations in the fractal dimension. During early hydration, particularly within the first 3 hours, the AS and aggregate composition significantly influence the fractal behavior of transition pores. The smaller the AS, the more distinct the fractal behavior.
Capillary pores do not exhibit fractal characteristics during the early stages of hydration, but their fractal dimension increases with time. From 0-1.5 hours, the change is slow, then accelerates from 2-10 hours, and after 24 hours, the fractal dimension exceeds 2.9 and stabilizes. The fractal dimension of capillary pores in W0.63 samples begins to show fractal characteristics after 4 hours of hydration, while in W1.25, B, W2.5, and W5 samples, the fractal dimension appears after 6 hours. The fractal dimension of machine-made sand is negatively correlated with AS. The fractal dimension changes in standard sand are the most complex within the first 6 hours, with the fractal dimension fluctuating, and the more complex the AS composition, the more intricate the early fractal dimension variations. Air pores, while always exhibiting fractal characteristics, show rapid increases in their fractal dimension during early hydration, stabilizing after about 10 hours, although the fractal dimension of air pores remains discontinuous.
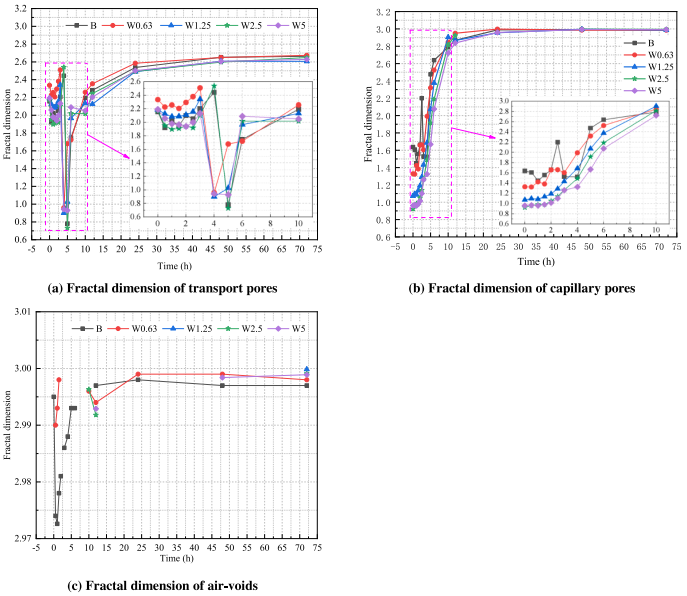
Figure 7: Fractal dimension changes of transition pores, capillary pores, and air pores during the hydration process for cement mortar with different aggregate sizes
Low-field NMR technology was used to investigate the pore water migration, water distribution, bleeding, and fractal characteristics of cement mortar with different AS during the early hydration process. The results indicate that AS has a significant impact on the hydration process of cement mortar. The conclusions are as follows:
1. As hydration progresses, hydration reactions occur on the pore surfaces, generating C-S-H and CH, consuming part of the water, leading to a reduction in pore size. Some capillary pores and voids are converted into transition pores, and some into gel pores. Therefore, transition pores play an intermediary role in pore variation and water transport.
2. The MRI bitmap data was used to establish a model of water distribution at different locations in the sample, analyzing the water distribution characteristics of cement mortars with different AS. AS is related to the uniformity of the initial water distribution in cement mortar, and the grading of sand can improve the uniformity of paste distribution. A smaller AS results in better dispersion of the cement paste, producing more ITZs and pores, which favors the formation of water transport channels.
3. The bleeding in cement mortar originates from capillary pores and air pores, mainly occurring during the sedimentation and consolidation process. The amount of bleed water is proportional to porosity and inversely proportional to the specific surface area of particles. The larger the AS, the faster the consolidation, leading to less bleed water. The effect of porosity on bleed water is much greater than that of AS.
4. Gel pores do not exhibit fractal characteristics, while capillary and transition pores show fractal characteristics after a certain period of hydration. The overall porosity exhibits fractal characteristics but lacks continuity. AS and aggregate composition influence the spatial distribution and fractal characteristics of the cement paste’s pores. The fractal dimension of pores is negatively correlated with pore size, and the more complex the aggregate composition, the more complex the fractal dimension changes in the initial stages.
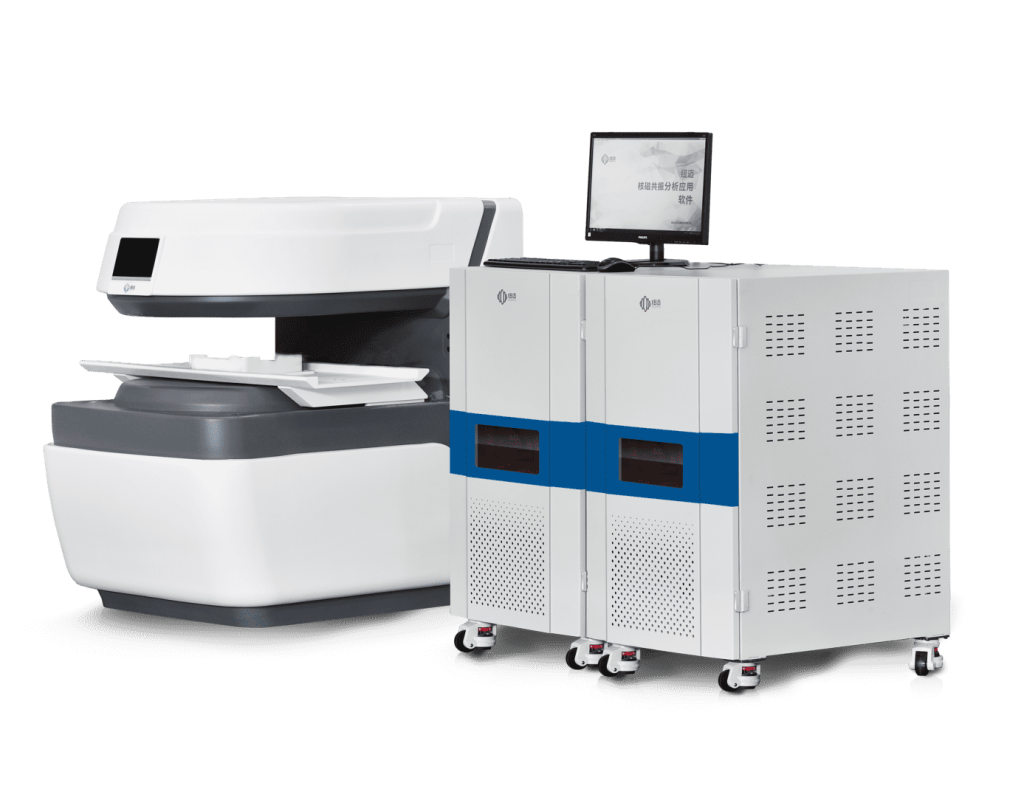
Large-caliber NMR Imaging Analyzer
If you are interested in the above applications, feel free to contact us at: 15618820062
[1] Lin Ning, Yu Zhao, Jing Bi, et al. Effect of aggregate size on water distribution and pore fractal characteristics during hydration of cement mortar based on low-field NMR technology [J]. Construction and Building Materials, 2023. 389:131670.
 Scan QR Code
 Scan QR Code
Phone: 400-060-3233
After-sales: 400-060-3233


Back to Top