
Professor Yu Zhao‘s Team, School of Civil Engineering, Guizhou University
Petroleum Science: Study on Water Infiltration Mechanism and Pore Structure Evolution in Fractured Sandstone Based on Low-Field Nuclear Magnetic Resonance

Research Team: Professor Yu Zhao’s Team, School of Civil Engineering, Guizhou University
Author Information: Shengfeng Wu¹, Yongfa Zhang¹, Yu Zhao¹, Chaolin Wang¹, Jing Bi¹, Anfa Long¹, Yan Li¹ School of Civil Engineering, Guizhou University
Abstract: During the extraction of sandstone gas reservoirs, near-wellbore natural fractures influence water infiltration and pore evolution; however, the underlying mechanisms remain unclear. This study employs real-time nuclear magnetic resonance (RT-NMR) technology to investigate the effects of near-wellbore fracture dip angles (α) of 0°, 15°, 30°, and 45° on fluid infiltration, migration patterns, and pore evolution mechanisms during water injection. The T₂ curves and magnetic resonance imaging (MRI) were monitored in real time throughout the water injection process. The evolution characteristics of the T₂ curves and MRI reveal the patterns of reservoir pore evolution and fluid infiltration during fluid pressurization. The results demonstrate that increasing the injection pressure (P~inj~) promotes the transformation of adsorption pores into seepage pores, leading to intensified pore damage. Pore damage primarily occurs during the rapid pressurization stage and is concentrated in the vicinity of the near-wellbore fracture. The fluid infiltration area and fluid flow rate are largest when α = 0° and smallest when α = 45°, indicating that α significantly influences fluid infiltration and migration pathways. The inclination of the infiltration front increases with α, which is attributed to the seepage rate of water along the fracture wall consistently exceeding that at the fracture tip. For field fracturing operations, it is recommended to align the perforation direction with the strike of natural fractures and to optimize the pressurization strategy by shortening the slow pressurization stage while extending the rapid pressurization stage. These findings provide important guidance for the selection of fracturing intervals and the optimization of injection parameters in sandstone gas reservoir extraction.
Research Background:
Hydraulic fracturing technology is an effective means for extracting unconventional oil and gas resources and has been widely applied in sandstone gas development. This technology injects fracturing fluid into the reservoir using high-pressure pumps, creating hydraulic fractures when the injection pressure exceeds the reservoir’s fracture pressure. The continuous injection of fracturing fluid promotes the progressive propagation of hydraulic fractures, which subsequently interconnect with natural fractures within the reservoir. This interaction forms an extensive and complex fracture network, significantly enhancing reservoir permeability and optimizing gas extraction efficiency in tight sandstone formations.
This study systematically investigates the influence of near-wellbore natural fractures on three key processes during water injection—fluid infiltration, pore water migration, and pore evolution mechanisms—using four typical scenarios illustrated in Figure 1. To achieve the research objectives, a set of specimens with pre-existing fracture angles (α) of 0°, 15°, 30°, and 45° were designed and fabricated (Figure 2(a)), followed by injection experiments. During the experiments, real-time nuclear magnetic resonance (NMR) technology was employed to monitor the evolution of T₂ curves and magnetic resonance imaging throughout the water injection process. The study comprehensively analyzes the evolution of injection pressure, fluid infiltration and migration patterns, and pore structure distribution characteristics under different dip angles of near-wellbore natural fractures. The influence of near-wellbore fracture dip angle on water infiltration behavior was investigated, revealing the mechanisms of fluid infiltration and pore damage. Based on these research findings, valuable guidance can be provided for field-scale fracturing design in tight sandstone gas reservoirs, particularly regarding the selection of fracturing intervals and optimization of injection parameters.
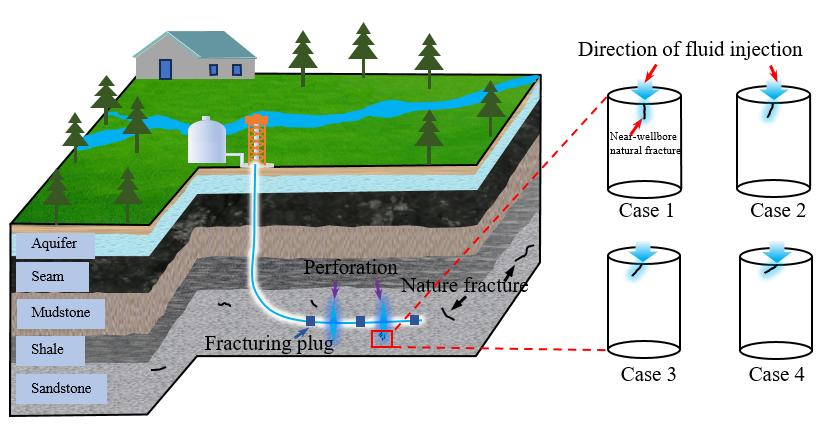
Figure 1 Schematic Diagram of Permeability Enhancement Technology in Sandstone Reservoirs
Sandstone blocks were processed into cylindrical specimens with a diameter of 25 mm and a height of 50 mm for this study. To simulate the influence of near-wellbore natural fractures on the hydraulic fracturing process, a pre-existing fracture with a width of 2 mm and a length of 10 mm was precisely fabricated on the top surface of each cylindrical rock specimen. The angle between the pre-existing fracture and the specimen axis was defined as the pre-existing angle α (see Figure 2(a)). The specimen axis direction also corresponds to the water injection direction.
To prevent water from infiltrating into the specimen from both ends of the pre-existing fracture, which could affect the experimental results, both ends of the pre-existing fracture were sealed using epoxy resin adhesive (see Figure 2(b)). Additionally, to prevent water from entering the specimen from any location other than the pre-existing fracture on the top surface during water injection, the top surface of the specimen was wrapped with waterproof tape (see Figure 2(b)). A water injection hole with a diameter of 2 mm was drilled to ensure that water could be injected into the pre-existing fracture during the experiment. Furthermore, scanning electron microscopy (SEM) images (see Figure 2(c)) reveal the presence of micropores between sandstone particles, suggesting that the complex pore structure may influence water migration behavior.
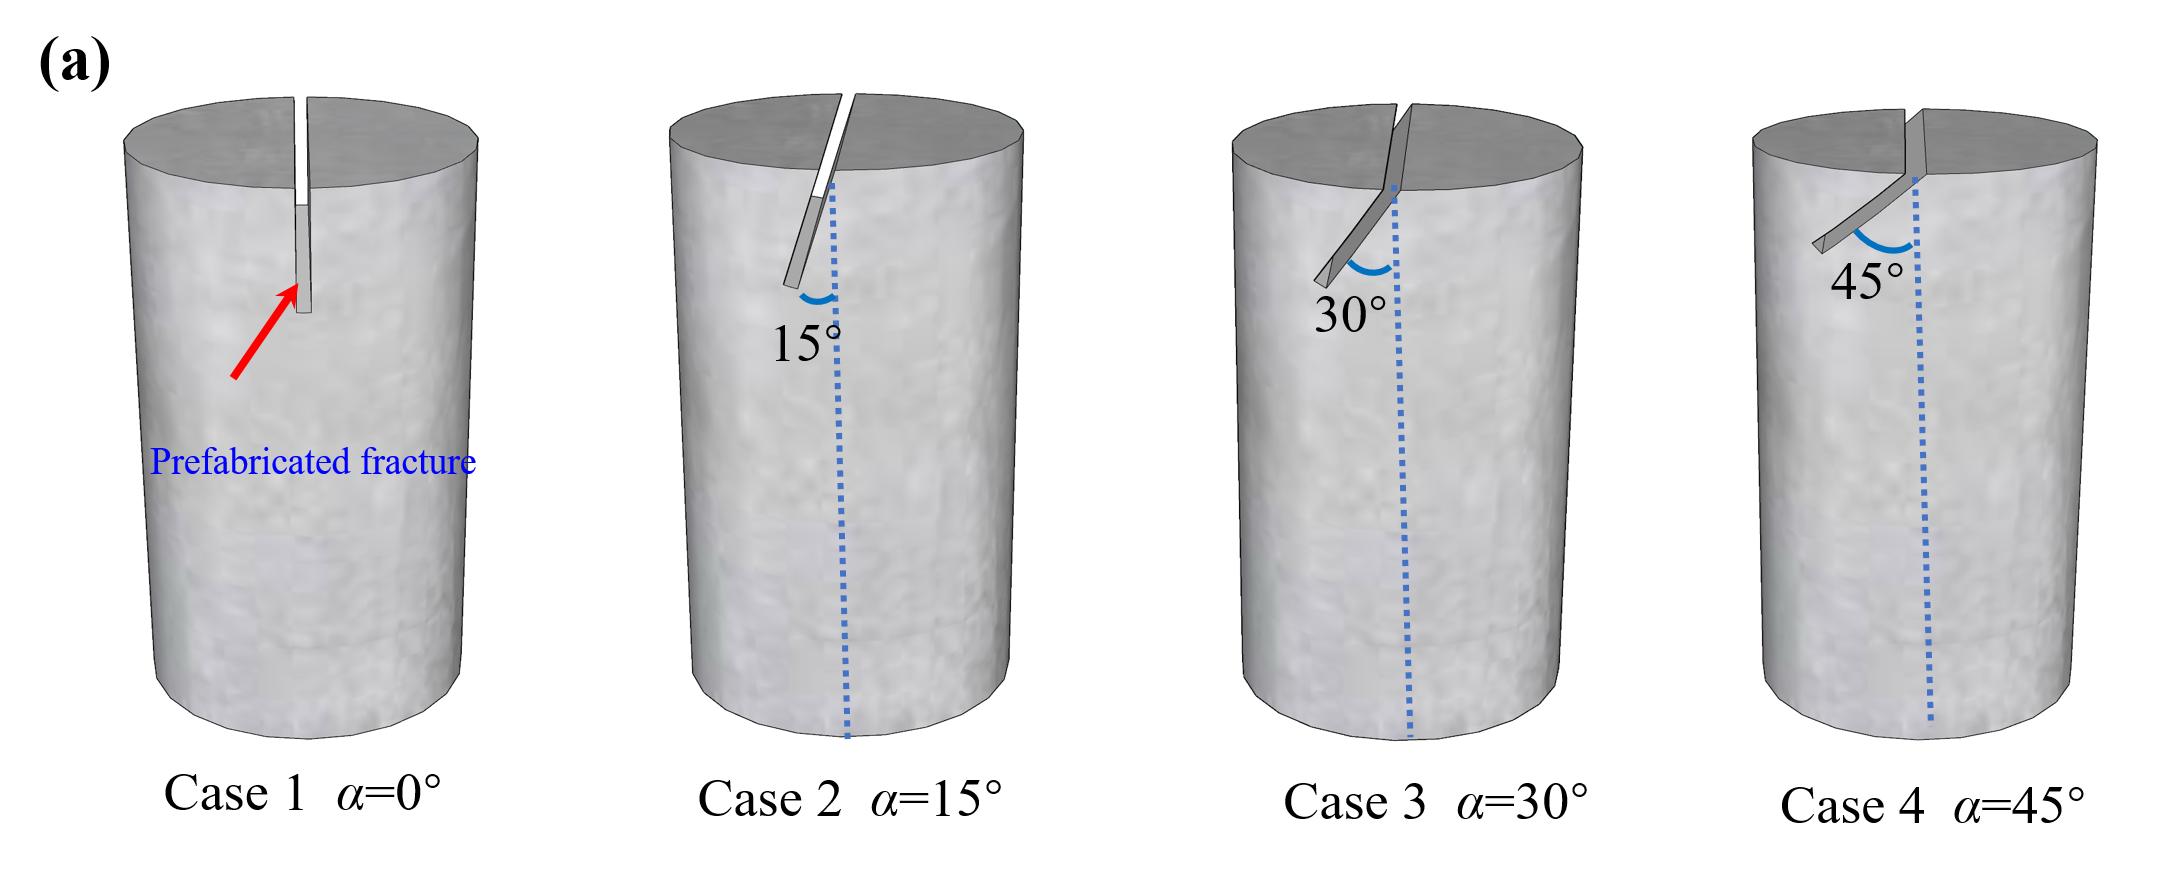
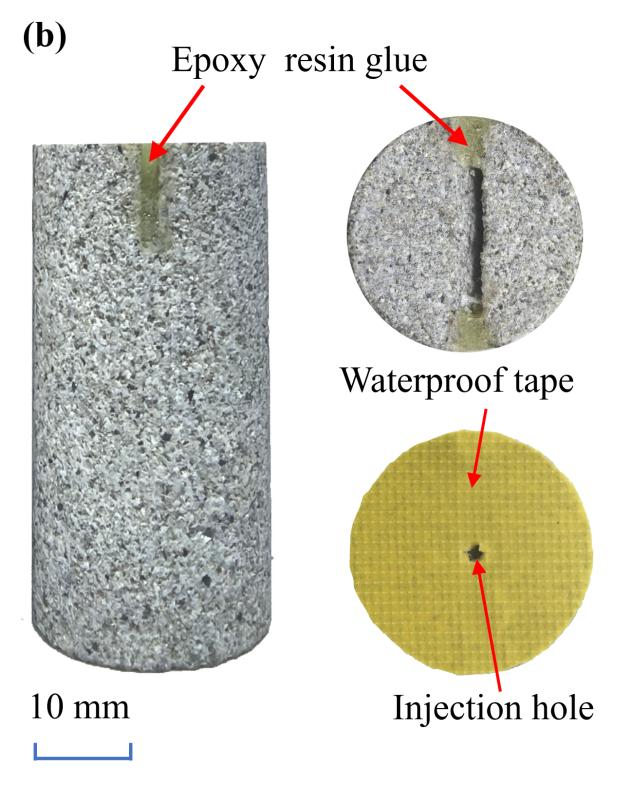
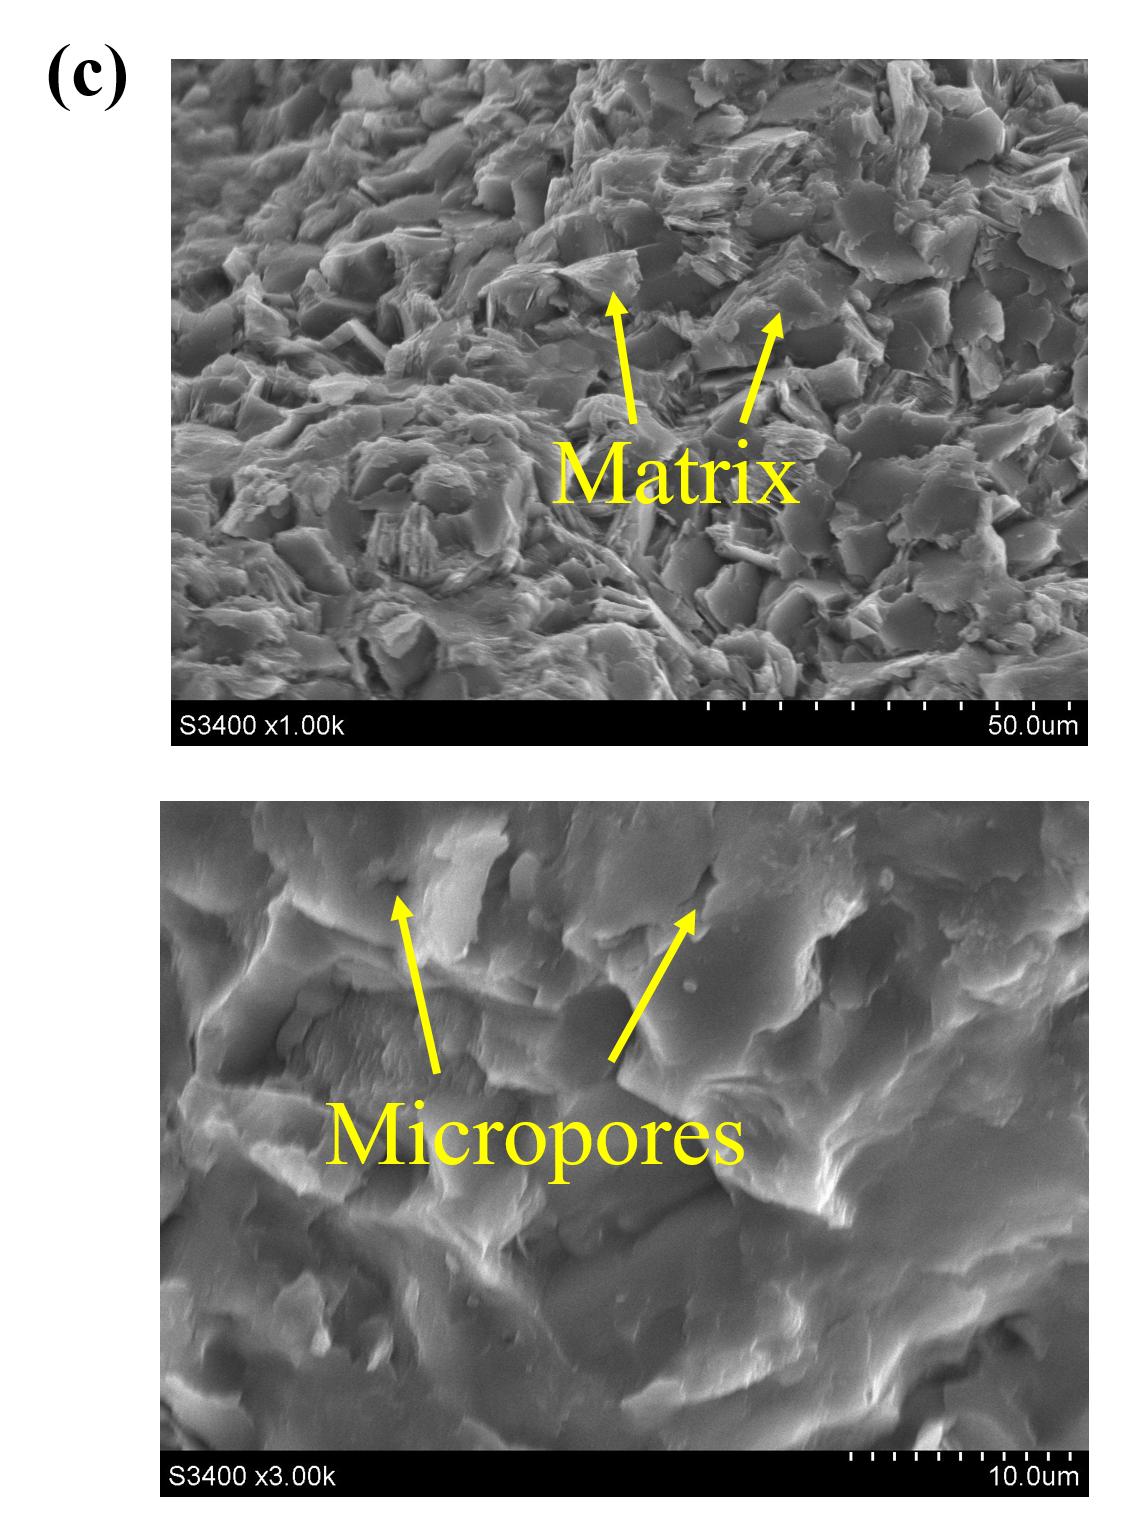
Figure 2 Sandstone Specimens. (a) Three-dimensional schematic diagram of specimen preparation. (b) Specimen with epoxy resin adhesive applied and wrapped with waterproof tape. (c) Scanning electron microscopy image of the sandstone specimen.
The experimental setup consisted of three components: I Water Injection System, II Pressure Loading System, and III Nuclear Magnetic Resonance System (see Figure 3(a)). The Water Injection System (I) included a computer control system and two syringe pumps. The syringe pumps could operate in either constant pressure mode or constant flow mode, providing a pressure range of 0.10–40 MPa and an injection rate range of 0.001–40 mL/min. Controlled by the computer, the two syringe pumps could automatically replenish water and switch between pumps based on remaining water volume, ensuring continuous and stable water supply, thereby avoiding experimental interruptions and maintaining consistent experimental conditions throughout the process. The Pressure Loading System (II) was used to apply controlled pressure to the specimens. In this study, the hydrogen-free (¹H) compound Fluorinert FC-40 was selected as the pressurizing medium for both axial and confining pressures. This medium was chosen because its lack of hydrogen nuclei prevents interference with the accuracy of T₂ and MRI measurements during the experiment. The Pressure Loading System (II) could apply a maximum axial pressure of 100 MPa and a maximum confining pressure of 40 MPa. The Nuclear Magnetic Resonance System (III) employed a MacroMR12-150H-I model (Suzhou Niumag Corporation, China), used to characterize pore structure and water infiltration characteristics. This system has a magnetic field strength of 0.3 T, a frequency of 12 MHz, and an operating temperature of 25–32 °C. The maximum gradient magnetic field strength is 0.15 T/m.
Prior to the water injection experiments, all specimens were dried in a laboratory oven at 105 °C for 24 hours to ensure complete removal of initial pore water, thereby eliminating potential interference with the experimental measurements. Subsequently, the specimens were allowed to cool naturally to ambient temperature (25 ± 2 °C) under room conditions before the water injection experiments began. The water injection experiments were conducted under precisely controlled triaxial stress conditions, with a confining pressure of 3 MPa and an axial pressure of 10 MPa. Throughout the experiments, a precision syringe pump was used to inject water at a constant injection rate of 0.30 mL/min, ensuring stable fluid delivery. The water injection procedure systematically involved two key steps: first, the system was started to thoroughly flush the pipelines, ensuring uniform drainage and expelling any air; second, the specimen was correctly connected to the system. This standardized approach effectively minimized experimental errors caused by trapped air in the injection system. When the injection pressure reached 0.10 MPa, the initial T₂ and MRI measurements were performed. Thereafter, T₂ and MRI signals were measured at injection pressure increments of 0.60 MPa, with final measurements recorded at the peak injection pressure. The detailed experimental procedure is illustrated in Figure 3(b).
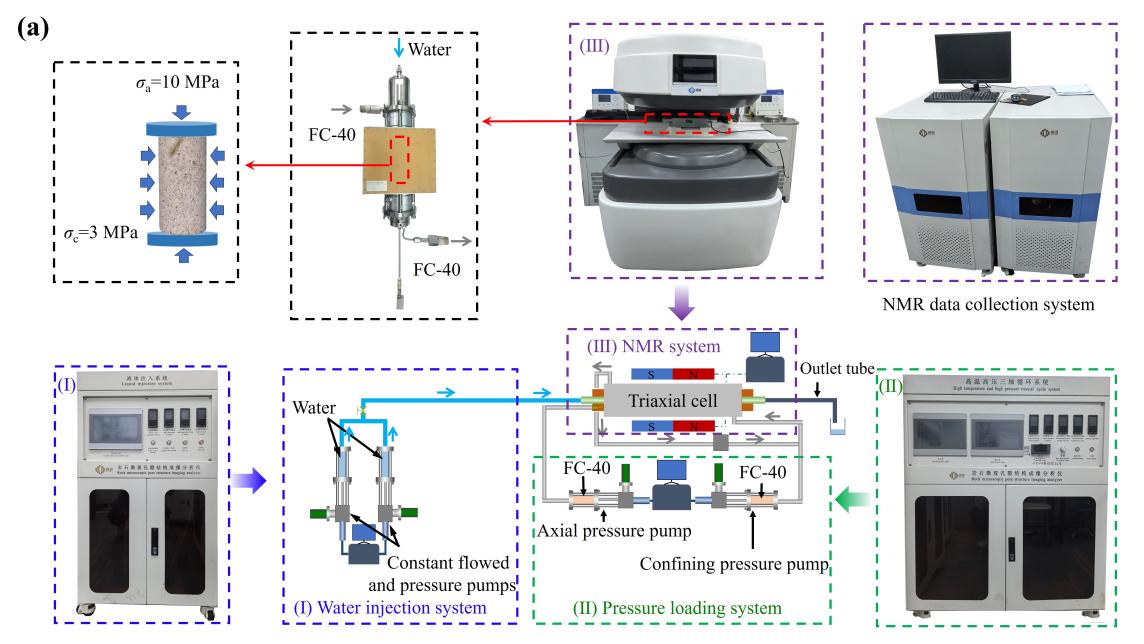
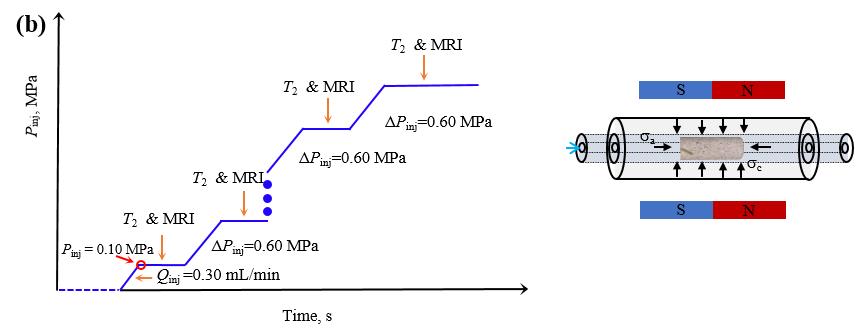
Figure 3 Experimental Equipment and Procedure: (a) Schematic Diagram of the Experimental System and Equipment, (b) Schematic Diagram of the Experimental Procedure.
(1) Evolution of Injection Pressure
Figure 4 presents statistical plots of water injection pressure (P~inj~), axial pressure (σ~a~), and confining pressure (σ~c~) over time during water injection. It should be noted that only the pressurization stages were considered, while the periods for T₂ and MRI measurements were excluded. Overall, regardless of the α value, the water injection process can be divided into four typical stages: Slow Pressurization Stage (Ⅰ), Stable Pressurization Stage (Ⅱ), Rapid Pressurization Stage (Ⅲ), and Constant Pressure Stage (Ⅳ). The injection pressure curve shows a gradual increase during the Slow Pressurization Stage, with no significant pressure increase; subsequently, the injection pressure continues to increase steadily, then accelerates rapidly, and finally stabilizes at a maximum value. Taking α = 0° (Specimen #1) as an example, during the Slow Pressurization Stage (Ⅰ), the injection pressure increased slowly, taking 2041 seconds to rise from 0 to 0.10 MPa. This slow pressure accumulation corresponds to the initial filling of the pre-existing fracture space with water. As water injection continued, the rate of injection pressure increase accelerated significantly, taking 3199 seconds to increase from 0.10 MPa to 0.70 MPa. Upon reaching the critical threshold of 0.70 MPa, the pressure surged rapidly to 3.30 MPa. Thereafter, the injection pressure remained essentially constant. The water infiltration rate inside the specimen became comparable to the water injection rate; therefore, despite continuous water injection, the injection pressure stabilized at 3.30 MPa. However, the maximum injection pressures varied with different α values.
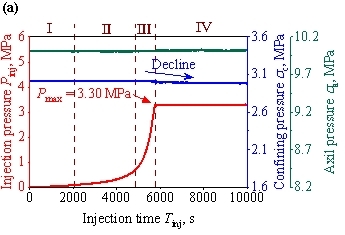
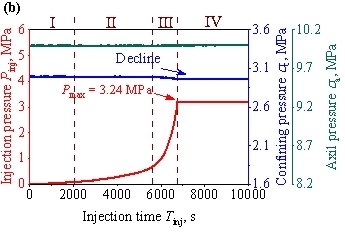
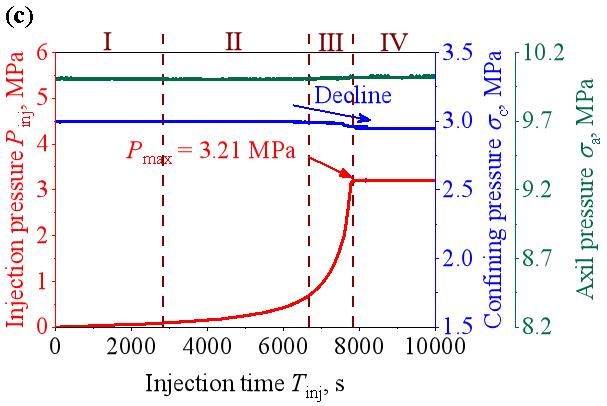
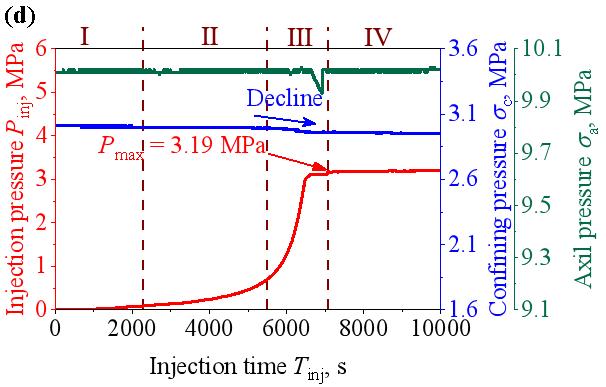
Figure 4 Curves of Water Injection Pressure, Axial Pressure, and Confining Pressure Over Time: (a) Specimen #1 (α = 0°), (b) Specimen #2 (α = 15°), (c) Specimen #3 (α = 30°), (d) Specimen #4 (α = 45°)
(2) Fluid Infiltration and Fluid Migration
Magnetic resonance imaging (MRI) enables visual representation of pore water migration and distribution during water injection. In Figure 5, black regions represent water-free areas, while a color gradient from blue to red indicates progressively higher water content, revealing the gradual increase in water infiltration. The length of the infiltration zone along the specimen’s radial direction is defined as the infiltration zone width, and the length along the axial direction is defined as the infiltration zone length (see Figure 5).
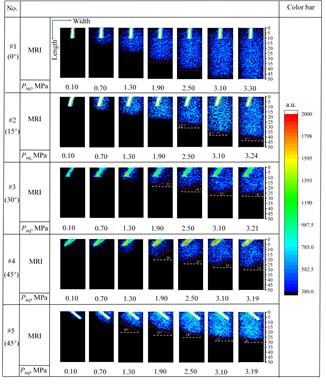
Figure 5 Evolution of the Fluid Infiltration Zone During Water Injection
Figure 5 illustrates the evolution of the fluid infiltration zone during water injection for specimens with different α values. As shown in Figure 5, during the Slow Pressurization Stage (Ⅰ), the water injected into the specimens primarily filled the pre-existing fracture space, with only a small amount of water infiltrating into the rock pores (P~inj~ = 0.10 MPa). Regardless of the α value, during water injection, fluid preferentially infiltrated along both side walls of the pre-existing fracture. As α increased, the water infiltration rate along the right side wall of the pre-existing fracture consistently exceeded that along the left side wall. As the injection pressure increased, the infiltration zone gradually expanded. Differences in α led to distinct morphologies of the infiltration zone.
Under the same injection conditions, the infiltration zone range for the specimen with α = 0° was larger than that for specimens with other angles (15°, 30°, 45°). After the pre-existing fracture space was completely filled with water and the infiltration zone entered the stable rising stage (Stable Pressurization Stage (Ⅱ)), water preferentially infiltrated more significantly from both sides of the pre-existing fracture and expanded radially to cover nearly the entire near-surface region of the specimen (P~inj~ = 0.70 MPa). When the injection pressure reached its peak value (end of the Rapid Pressurization Stage (Ⅲ)), the fluid infiltration zone extended to the bottom of the specimen for α = 0°. For the specimen with α = 15°, the infiltration zone width at an injection pressure of 0.70 MPa was smaller than that for α = 0° under the corresponding pressure. Furthermore, unlike the α = 0° case, when the injection pressure reached its maximum, the fluid infiltration zone did not extend to the bottom of the specimen. When α increased to 30°, the infiltration zone width at 0.70 MPa decreased further. When α further increased to 45°, within the injection pressure range from 0.10 MPa to 1.90 MPa, the fluid infiltration zone width was significantly smaller compared to that at 30°.
(3) Pore Structure Distribution Characteristics
Figure 6 illustrates the evolution of T₂ curves during water injection for specimens with different α values. Water in pores of different sizes exhibits different transverse relaxation times in the magnetic field. Changes in the T₂ curve can reflect the evolution of the specimen‘s pores. Overall, regardless of the α value, increasing the injection pressure during water injection primarily affects adsorption pores (T₂ in the range of 0.01–10 ms) and a portion of seepage pores (T₂ in the range of 10–100 ms), while larger seepage pores (T₂ > 100 ms) show relatively minor changes. In the range of 0.50–100 ms, as the injection pressure increases, the T₂ curves shift to the right, indicating a gradual increase in pore volume for the corresponding pore systems during water injection.
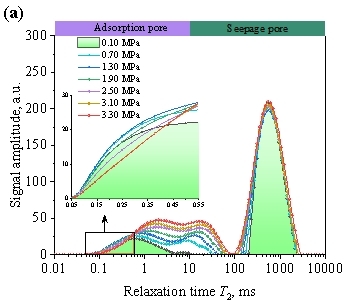
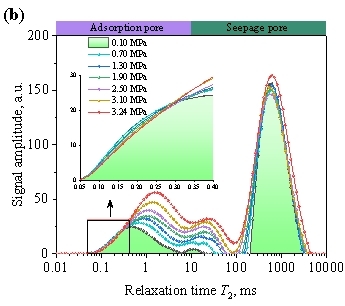
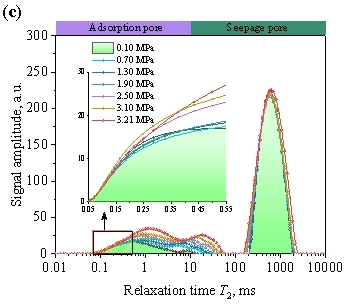
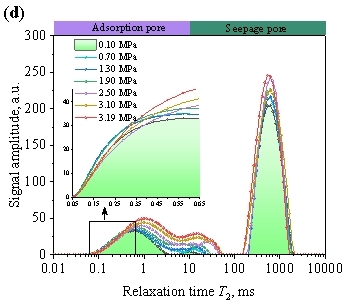
Figure 6 Evolution of T₂ Curves During Water Injection: (a) Specimen #1 (α = 0°), (b) Specimen #2 (α = 15°), (c) Specimen #3 (α = 30°), (d) Specimen #4 (α = 45°)
Under different α conditions, the pore evolution trends with increasing injection pressure exhibit subtle differences, particularly evident when the relaxation time is below 0.55 ms. We focus on the curve segment within the relaxation time range of 0.05 ms to 0.58 ms to investigate the migration mechanism of fluid within this pore fraction during pressurization. For simplicity of description, we refer to this fraction of micropores as nanopores to characterize the changes in pores within this size range during water injection. It should be noted that the definition of nanopores in this study is solely for the purpose of concise and clear description; therefore, the determined relaxation time range for nanopores may differ from definitions used by other researchers. For Specimen #1 (α = 0°), when the injection pressure increased from 0.10 MPa to 1.30 MPa, the T₂ curve in the range of 0.01–0.55 ms shifted leftward with a simultaneous increase in amplitude. This change in the curve indicates that during the Slow Pressurization Stage (Ⅰ), Stable Pressurization Stage (Ⅱ), and the early part of the Rapid Pressurization Stage (Ⅲ), more water entered the nanopores. As the injection pressure further increased (Rapid Pressurization Stage (Ⅲ)), the curve in the range of 0.02–0.43 ms shifted rightward with a decrease in amplitude, indicating a reduction in nanopores. For α = 15°, 30°, and 45°, the nanopores generally exhibited a trend of first increasing and then decreasing with increasing injection pressure, which is similar to the evolution pattern observed for Specimen #1 (α = 0°). However, due to differences in α, subtle variations in the T₂ curve changes are observed.
Comparing the locally enlarged views of the T₂ curves for different specimens, it can be observed that the magnitude of the rightward shift of the T₂ curve decreases as α increases (see Figure 6). For α = 0°, as the injection pressure increased, the T₂ curve in the relaxation time range of 0.02–0.43 ms exhibited a rightward shift with a decrease in amplitude. When α increased to 15° and 30°, this range narrowed to 0.02–0.29 ms and 0.02–0.22 ms, respectively. Notably, when α reached 45°, the shift range of the T₂ curve was consistent with that of Specimen #3. This indicates that the ability of nanopore sizes to adjust during water injection gradually weakens as α increases. Furthermore, the magnitude of the rightward shift and amplitude decrease of the T₂ curve also diminishes with increasing α: the magnitude was largest for α = 0°, followed by α = 15°, and smallest for α = 30° and 45°. In summary, although the evolution trend of the T₂ curve within the adsorption pore range during increasing injection pressure is similar, differences in α lead to distinct characteristics in the changes of some nanopore structures after the injection pressure reaches its maximum.
By integrating the T₂ curves over relaxation time, the corresponding pore space distribution can be obtained. To gain a deeper understanding of the influence of fracture dip angle α on the specimen’s pore structure during water injection, statistical analysis of pore distribution was performed for different α values, with results shown in Figure 7. It should be noted that before the injection pressure reached 0.10 MPa (Slow Pressurization Stage (Ⅰ)), the injected water primarily filled the pre-existing fracture space, with a relatively small amount infiltrating into the specimen pores. Overall, as the injection pressure increased, the proportion of water infiltrating into adsorption pores decreased, while the proportion infiltrating into seepage pores increased. For α = 0°, as the injection pressure increased from 0.70 MPa to the maximum of 3.30 MPa (Rapid Pressurization Stage (Ⅲ)), the proportion of adsorption pores decreased from 54.33% to 39.20%, a reduction of 15.13%; the proportion of seepage pores correspondingly increased from 45.67% to 60.80%. For α = 15°, as the injection pressure increased from 0.70 MPa to the maximum of 3.21 MPa, the proportion of adsorption pores decreased from 52.79% to 43.30%, a reduction of 9.49%. When α increased to 30°, the proportion of adsorption pores decreased from 62.89% to 38.79%, while the proportion of seepage pores increased from 37.11% to 61.21%. When α increased to 45°, as the injection pressure increased from 0.70 MPa to the maximum of 3.19 MPa, the reduction in the proportion of adsorption pores was 13.20%. In summary, as the injection pressure increases, the proportion of water infiltrating into adsorption pores shows a decreasing trend. During the Rapid Pressurization Stage (Ⅲ), the transformation process from adsorption pores to seepage pores accelerates.
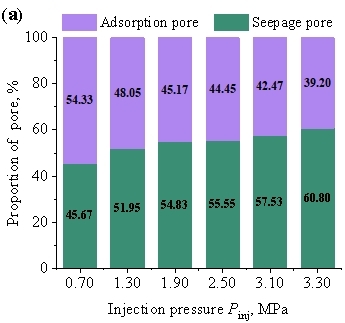
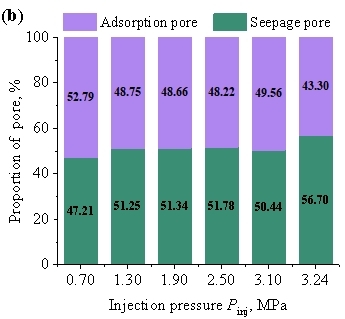
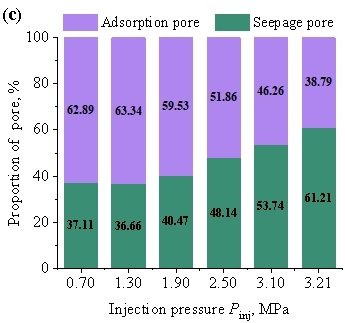
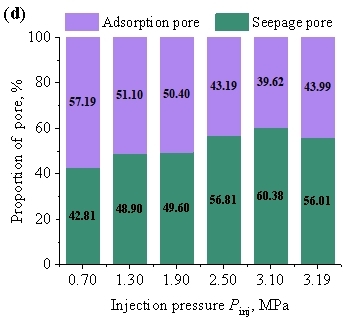
Figure 7 Pore Evolution During Water Injection. (a) Specimen #1 (α = 0°). (b) Specimen #2 (α = 15°). (c) Specimen #3 (α = 30°). (d) Specimen #4 (α = 45°).
Discussion:
(1) Water Infiltration and Pore Damage Mechanisms
Figure 12 presents a schematic diagram of water infiltration and migration during water injection. After water enters and infiltrates the specimen, the pores within the fluid infiltration zone remain partially water-filled. As shown in Figure 8(a), during the Slow Pressurization Stage (Ⅰ), due to the low water injection pressure (P~inj~ < 0.10 MPa) and limited water infiltration, the amplitude of the T₂ curve is relatively small. As the injection pressure increases, more fluid infiltrates the specimen, and the number of filled adsorption pores and seepage pores continuously increases (see Figure 8(b)). Additionally, during the Slow Pressurization Stage (Ⅰ) and Stable Pressurization Stage (Ⅱ), due to the small infiltration volume, some micropores inside the specimen are not completely filled by infiltrating water, forming unsaturated pores (see Figure 8(c)). As the injection pressure continues to increase, more water infiltrates the specimen, promoting the gradual expansion of the infiltration zone. Previously partially filled micropores become fully saturated, and more micropores become filled with water (see Figures 8(b) to (d)). On one hand, when water infiltrates the sandstone, some minerals (montmorillonite, illite) dissolve, thereby increasing the pore sizes within the specimen. On the other hand, as the injection pressure further increases, these saturated pores are subjected to pore pressure, and the rock skeleton expands outward under the action of pore stress, leading to a slight increase in pore size (see Figures 8(d) to (e)). Furthermore, during the Rapid Pressurization Stage (Ⅲ), the rapid increase in fluid pressure not only promotes fluid infiltration but also facilitates the transformation of adsorption pores into seepage pores. Consequently, as fluid pressure increases, the proportion of adsorption pores in the specimen gradually decreases, while the proportion of seepage pores gradually increases.
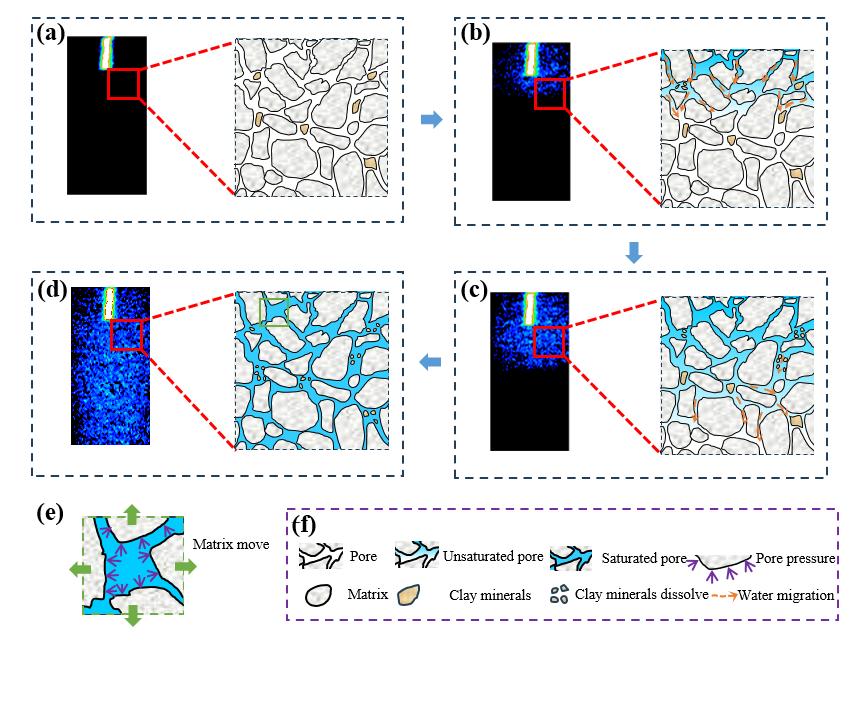
Figure 8 Schematic Diagram of Dynamic Water Migration Mechanisms. (a) Stage (Ⅰ): Pore Distribution. (b) Stage (Ⅱ): Water Infiltration. (c) Stage (Ⅲ): Unsaturated Fluid Infiltration Zone. (d) Stage (Ⅳ): Saturated Fluid Infiltration Zone. (e) Pore Size Enlargement. (f) Legend.
The changes in the T₂ curve reflect the variation in water content inside the specimen. As the injection pressure increases, the amplitude of the T₂ curve gradually increases, indicating a corresponding increase in the water content of the sandstone during fluid pressurization. Notably, the T₂ curve initially shows a leftward shift with increasing amplitude, followed by a rightward shift with decreasing amplitude (in the 0.01–0.55 ms range, see Figure 6), revealing that during water injection, pores sequentially undergo saturation filling and subsequent pressure-induced pore expansion. In this study, since the injection pressure was consistently maintained below 3.30 MPa, the pore pressure generated within the fluid infiltration zone was relatively low, insufficient to create new pores within the specimen. Therefore, the phenomenon of pore size enlargement (rightward shift of the T₂ curve with decreasing amplitude as injection pressure increases) is primarily attributed to pore expansion caused by increasing pore pressure.
Furthermore, existing research indicates that water infiltration creates a pressure gradient within the fluid infiltration zone of the sandstone, with pore pressure gradually decreasing from the infiltration point toward the periphery of the fluid infiltration zone. Consequently, the pore damage induced by water injection is mainly concentrated near the pre-existing fracture (see Figure 5). As the injection pressure increases, the fluid infiltration zone gradually expands, increasing the distance between the pre-existing fracture (infiltration point) and the outer edge of the fluid infiltration zone. With increasing distance, the pore pressure near the water infiltration front tends to become more uniform, resulting in similar diffusion rates within the fluid infiltration zone. Therefore, for a given α, the inclination of the water infiltration front decreases as the injection pressure increases (see Figure 5). This change indicates that the dominant direction of fluid infiltration and migration is closely dependent on the water injection pressure and the spatial distribution of pore pressure within the sandstone. Specifically, higher injection pressure and a larger fluid infiltration zone promote a more uniform pressure distribution, thereby influencing the fluid infiltration path and overall migration behavior.
(2) Influence of Fracture Dip Angle on Fluid Infiltration
Sandstone is a sedimentary rock composed of cemented sand particles, and the fine pores developed between these sand particles constitute the pathways for fluid seepage. When fluid contacts sandstone under pressure, it infiltrates (or penetrates) into the sandstone through these pores. For reservoirs containing fractures, once the fracture space is filled with fluid, the fluid pressure acts directly on the fracture walls and the fracture tip. This study found that before water infiltrates radially to reach the specimen surface, the seepage volume along the walls of the pre-existing fracture is significantly greater than that at the fracture tip. The area of the pre-existing fracture walls is much larger than the cross-sectional area of the fracture tip in contact with water. As the contact area increases, the number of water seepage channels increases, making it easier for water to infiltrate. Therefore, during water injection, water preferentially seeps along the walls of the pre-existing fracture at a faster rate than at the fracture tip, resulting in a larger width than height of the fluid infiltration zone. However, in this study, once water permeated to the specimen surface, the advantage of water seepage along the pre-existing fracture walls diminished due to the constraints of the specimen size.
As α increases, the radial width of the fluid infiltration zone decreases under the same injection pressure conditions (see Figure 5). Since the direction of the force exerted by water is perpendicular to the surface on which it acts, a change in α leads to a corresponding change in the direction of the force exerted by water inside the specimen. The water accumulated within the pre-existing fractures at different α exerts different forces on the fracture walls. To facilitate description of the change in the direction of the fluid force, this study defines the angle between the direction of the water force (F~w~) acting on the pre-existing fracture wall and the radial direction of the specimen as β. We have drawn a schematic diagram of sandstone pores illustrating the effect of water infiltration on pores, as shown in Figure 9. From Figure 9(b), it can be seen that when α = 0°, β = 0°, and the direction of the water force acting on the pre-existing fracture wall coincides with the *x*-direction, with F~w-x~ = F~w~. As α increases, β gradually increases, and F~w-x~ = cosβ ∙ F~w~. Therefore, F~w-x~ gradually decreases with increasing α. Under the same injection pressure conditions, the width of the fluid infiltration zone decreases as α increases.
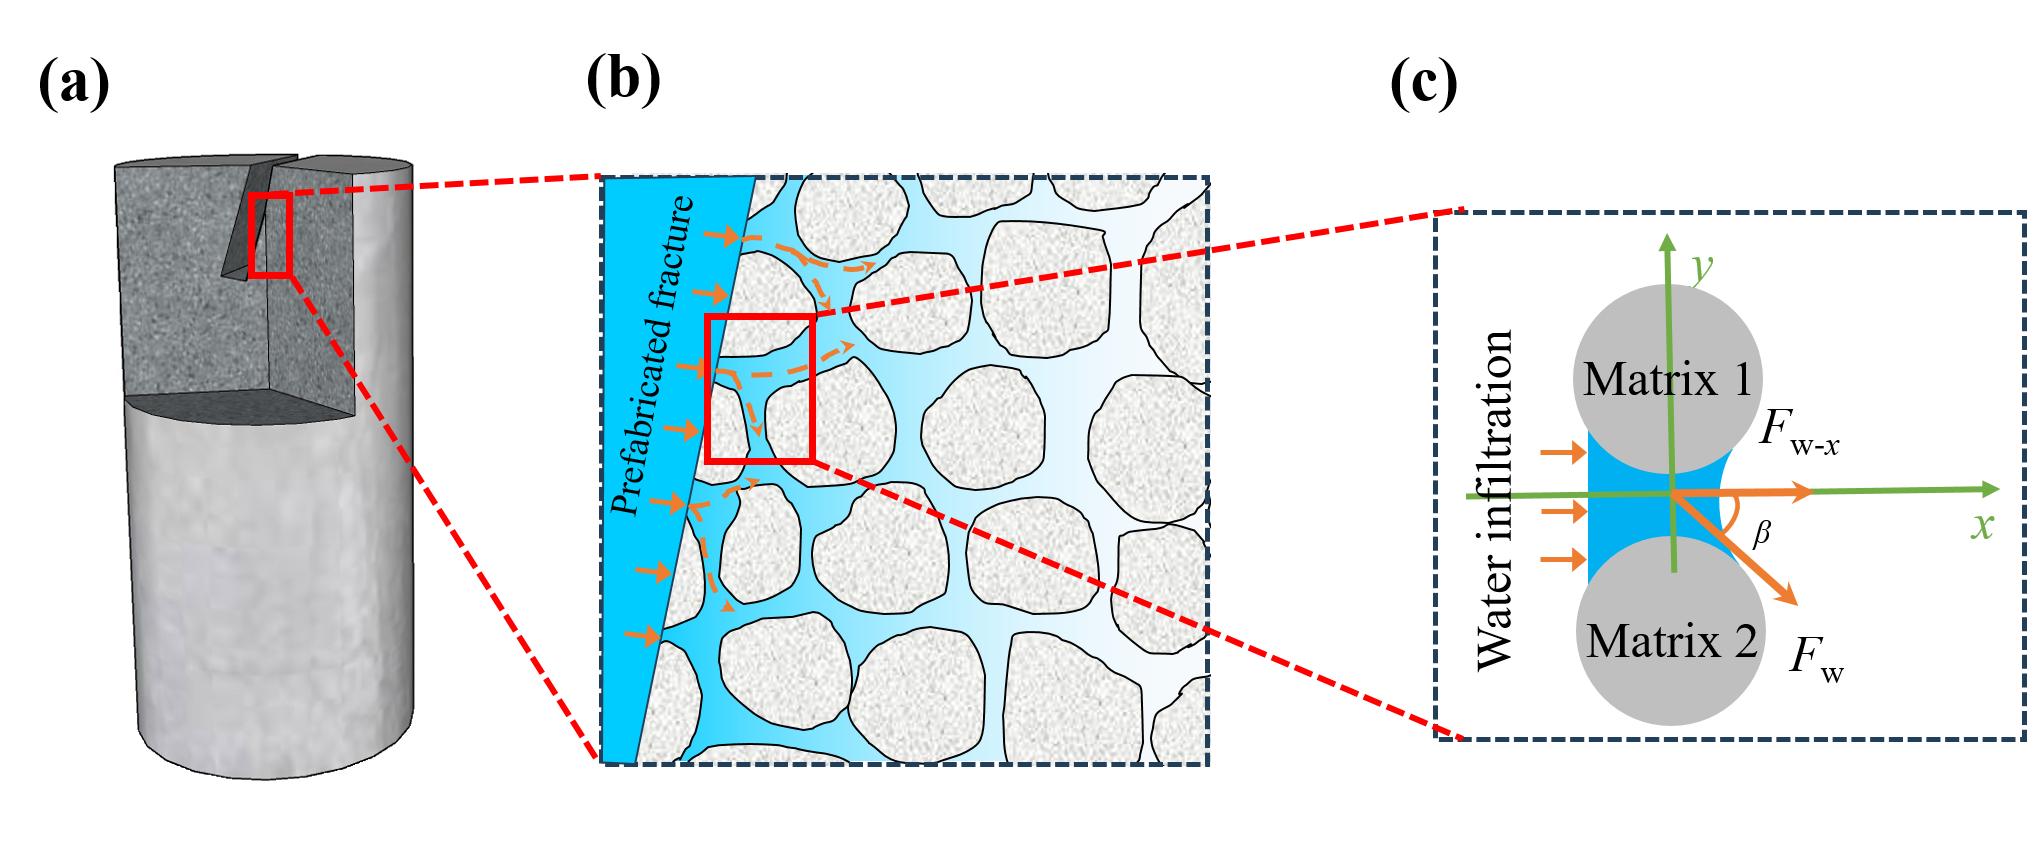
Figure 9 Schematic Diagram of Water Infiltration Mechanisms. (a) Sandstone Specimen. (b) Water Migration. (c) Water Pressure.
As the fluid pressure increases, the fluid infiltration zone gradually expands. Furthermore, the geometry of fractures within the rock significantly influences the geometry of fluid intrusion. This study found that variations in the pre-existing fracture dip angle (α) significantly affect both the size and morphology of the fluid infiltration zone. As shown in Figure 5, α influences the length of the fluid infiltration zone and the angle of the fluid infiltration front. During water injection, fluid infiltrates from the walls and the tip of the pre-existing fracture. Since the number of seepage channels on both side walls of the pre-existing fracture is far greater than at the tip, water primarily flows or infiltrates along the two side walls. When α = 0°, the infiltration zones on both side walls of the pre-existing fracture remain uniform, and the water infiltration rates from both side walls are roughly equal; therefore, the water infiltration front is approximately horizontal. As α increases, the difference in the area of the pre-existing fracture walls in direct contact with water becomes increasingly significant. Influenced by the cylindrical geometry of the specimens used in this study, the effective area of the pre-existing fracture wall opposite the dip angle gradually decreases with increasing α, leading to a corresponding reduction in seepage channels. Consequently, the water infiltration rate from the pre-existing fracture wall opposite the dip angle decreases, causing a change in the morphology of the fluid infiltration zone, with the infiltration front exhibiting a distinct inclination. Furthermore, as α increases, the difference in fluid infiltration rates between the two side walls of the pre-existing fracture widens, resulting in a corresponding increase in the angle of the fluid infiltration front; that is, the inclination of the fluid infiltration front increases with α (see Figure 5).
(3) Implications for Field Fracturing
Understanding the interaction mechanisms between water and reservoir rock at various stages of water injection is crucial for field fracturing design. For tight sandstone reservoirs, pore damage induced by water injection is particularly critical for the formation of hydraulic fractures and the enhancement of reservoir permeability. Based on the experimental results, it is recommended to optimize field fracturing operations by adjusting injection parameters, specifically by increasing the injection rate to shorten the duration of the initial Slow Pressurization Stage (Ⅰ), thereby improving overall fracturing efficiency. The duration of the Rapid Pressurization Stage (Ⅲ) during fracturing can be effectively extended through two main approaches: reducing the injection rate or adopting a constant pressure injection strategy. These methods can promote deeper infiltration of water throughout the reservoir matrix, accelerate the transformation of adsorption pores to seepage pores over a larger area, enhance near-wellbore reservoir damage, create favorable conditions for hydraulic fracture initiation, and ultimately improve the overall reservoir permeability.
Furthermore, this study shows that compared to natural fractures with larger angles, near-wellbore natural fractures with smaller angles are more favorable for fluid infiltration, resulting in a larger fluid infiltration zone and promoting the evolution of adsorption pores into seepage pores. Therefore, in field fracturing operations, it is recommended to perform detailed characterization of the development and distribution characteristics of natural fractures in the reservoir. When a fracturing interval is selected in a reservoir containing natural fractures, the perforation orientation should be adjusted to minimize the angle between the injection direction and the fractures, with 0° being the optimal angle.
However, it should be noted that during the Rapid Pressurization Stage, fluid pressure causes damage to pores, and this process is accompanied by fluid seepage, making it difficult to precisely quantify the quantitative relationship between the increase in fluid pressure and pore damage. We will explore this area in depth in future research using numerical simulation methods.
In this study, real-time nuclear magnetic resonance (RT-NMR) technology was employed to systematically investigate the influence of near-wellbore fracture dip angle (α) on fluid infiltration, migration patterns, and pore evolution mechanisms. The evolution characteristics of T₂ curves and MRI images were monitored in real time throughout the water injection process. The variations in injection pressure under different pre-existing fracture dip angles were systematically analyzed. Through combined analysis of T₂ curves and MRI images, the characteristics of pore evolution and pore water migration were investigated. Finally, the mechanisms by which α influences water infiltration and pore evolution during water injection were explored, and practical implications for field fracturing operations were proposed based on the experimental results. The main conclusions are as follows:
(1) Water infiltration behavior exhibits significant differences under different water injection pressures. During the Slow Pressurization Stage (Ⅰ), water primarily flows into the pre-existing fracture. With continuous water injection, during the Stable Pressurization Stage (Ⅱ), although the injection pressure is low and the fluid infiltration zone is limited, the seepage rate reaches its maximum. Most pore damage occurs during the Rapid Pressurization Stage (Ⅲ), where higher pressures drive significant structural changes within the specimen.
(2) Fluid infiltration promotes the transformation of pores from an unsaturated state to a saturated state. Increasing the water injection pressure can enlarge pore sizes in the saturated zone and promote the transformation of adsorption pores into seepage pores, with the proportion of adsorption pores gradually decreasing accordingly. Due to the existence of a pressure gradient within the fluid infiltration zone, the damage induced by injection pressure is primarily concentrated in the vicinity of the near-wellbore fracture.
(3) The pre-existing fracture dip angle (α) significantly influences fluid infiltration and migration. The seepage rate is fastest and the fluid infiltration zone is largest when α = 0°, while the fluid infiltration zone is smallest when α = 45°. Regardless of the α value, the seepage rate of water along the fracture walls consistently exceeds that at the fracture tip, and the inclination of the fluid infiltration front increases with increasing α.
(4) The experimental results indicate that to optimize fracturing parameters, the perforation direction (injection direction) should be aligned parallel to the fracture strike, the duration of the Slow Pressurization Stage should be shortened, and the duration of the Rapid Pressurization Stage should be extended.
Recommended Equipment:
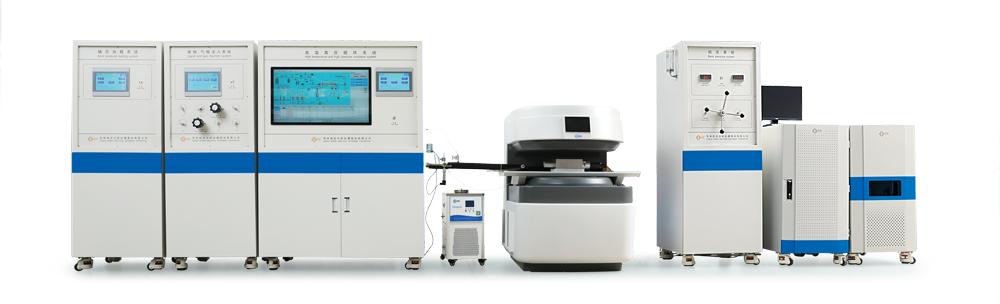
Large Aperture Nuclear Magnetic Resonance Imaging Analyzer
Reference:
[1] Wu S F, Zhang Y F, Zhao Y, et al. Real-time NMR investigation of water infiltration mechanisms and pore structure evolution in fractured sandstone near-wellbore regions[J]. Petroleum Science, 2025.
 Scan QR Code
 Scan QR Code
Phone: 400-060-3233
After-sales: 400-060-3233


Back to Top