


The production and consumption of cement and concrete account for approximately 7 % of global anthropogenic CO₂ emissions annually. Therefore, a deep understanding of the cement hydration mechanism is essential—not only for improving the mechanical properties and durability of concrete, but also for advancing the development of novel low‑carbon and environmentally friendly cementitious materials. Cement hydration is a complex chemical reaction process influenced by multiple factors, including water‑to‑cement ratio, admixtures, external conditions, and cement particle characteristics, all of which directly affect concrete performance.

In terms of research methods, conventional techniques such as isothermal calorimetry, ATR‑FTIR spectroscopy, and synchrotron X‑ray microtomography have been used to study the hydration process, but each has notable limitations:
Isothermal calorimetry primarily relies on heat evolution to assess the degree of hydration. This thermal signal interpretation is relatively macroscopic and cannot directly provide detailed information on microstructural evolution or pore water distribution during hydration.
ATR‑FTIR spectroscopy is mainly used to capture the formation of calcium silicate hydrate (C‑S‑H) in the early stage. Its applicable time window is narrow, focusing on the detection of specific early‑stage products, and it struggles to cover the entire hydration process in real time.
Synchrotron X‑ray microtomography can investigate the morphology and formation rate of hydration products in 3D and 4D, but it typically relies on large‑scale synchrotron radiation facilities, making routine, continuous, and real‑time monitoring of the hydration process difficult.
Low‑field nuclear magnetic resonance (LF‑NMR) technology offers significant advantages over conventional methods for studying cement hydration.
01 Non‑destructive, real‑time, in‑situ monitoring
Two‑dimensional T₁–T₂ NMR spectra enable real‑time observation of hydration products and internal pore water distribution at different stages of cement hydration—a capability difficult to achieve with conventional sampling or off‑line analysis, which inevitably disturb or damage the sample.
02 High time resolution for capturing rapid initial reactions
Because the initial reaction after cement‑water contact is fast and short‑lived, T₂ tests were performed every 3 minutes during the first 30 minutes. This high‑frequency sampling capability is unmatched by conventional techniques.
03 Strong quantitative characterization capability
NMR signal intensity can be directly used to estimate the degree of hydration, while changes in relaxation time provide information on water migration pathways during hydration. Moreover, NMR signal evolution allows intuitive and quantitative observation of water migration throughout the hydration process.
04 Accurate distinction of different hydrogen‑containing compounds and pore water fractions in cementitious materials
Two‑dimensional T₁–T₂ spectra offer excellent chemical specificity, enabling accurate distinction of different hydrogen‑containing compounds and various pore water fractions in cementitious materials. For example, they can clearly differentiate bound water in C‑S‑H gel pores, free water in capillary pores, and specific hydration products such as calcium hydroxide and ettringite—providing far more microscopic and detailed information than conventional macroscopic testing techniques.
Research Case: Investigation of the cement hydration process based on 2D nuclear magnetic resonance T₁–T₂ spectrum and entropy theory [1]
Sample Information
White cement paste was prepared with water‑to‑cement ratios of 0.35 and 0.45 (white cement was used to ensure measurement accuracy, as NMR sensitivity is significantly affected by paramagnetic substances. Results for the W/C = 0.35 sample are presented in this case).
Experimental Equipment
Low‑field NMR: MacroMR12‑150H‑I (Suzhou Niumag Analytical Instrument Corporation)
Experimental Protocol
NMR T₂ measurements
A CPMG sequence with a 60 mm coil was used at a constant temperature of 25 °C. Immediately after mixing, the sample was injected into F46 Teflon heat‑shrink tubing (28 mm diameter, 100 mm length), and both ends were sealed to prevent water evaporation. The measurement schedule was: every 3 minutes for the first 30 minutes; every 15 minutes from 30 minutes to 3 hours; every 30 minutes from 3 to 6 hours; every 60 minutes from 6 to 12 hours; and then once daily for 7 days.
Two‑dimensional T₁–T₂ NMR measurements
An IR‑CPMG sequence with a 60 mm coil was used. The measurement schedule was: once per hour for the first 3 hours; once every 2 hours from 3 to 9 hours; and then once daily for 7 days.
Experimental Analysis
1D T₂ relaxation spectra results:
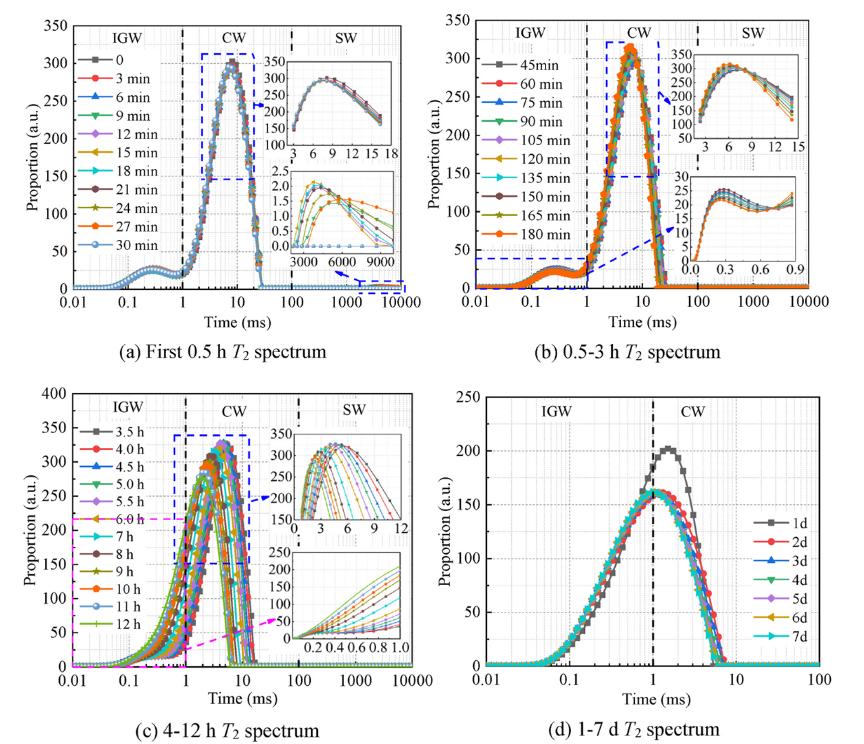
T₂ spectra of W0.35 cement hydration
1.During the first 30 minutes, interlayer and gel water (IGW) showed no significant change, and the capillary water (CW) peak only shifted slightly leftward. Surface water (SW) reached its maximum signal intensity at 15 minutes and then gradually diminished until disappearing completely, indicating that the initially formed free water was rapidly consumed.
2.From 45 minutes to 3 hours, the IGW peak area decreased, while the CW peak shifted leftward with increased signal intensity. This occurred because the attachment of hydration products reduced the pore surface area and hindered free water from entering gel pores through capillary pores. The continuous consumption of water by hydration reactions resulted in weaker IGW signals.
3.Between 4 and 12 hours, the CW peak further shifted leftward and gradually reached its maximum signal intensity, then weakened with increasing hydration time. Meanwhile, the T₂ spectrum merged into a single peak, and the IGW peak area increased rapidly.
4.After two days of hydration, the peak area no longer changed significantly, with the corresponding relaxation time approximately 1.0 ms, indicating that the hydration reaction had entered a relatively stable stage.
2D component classification model:
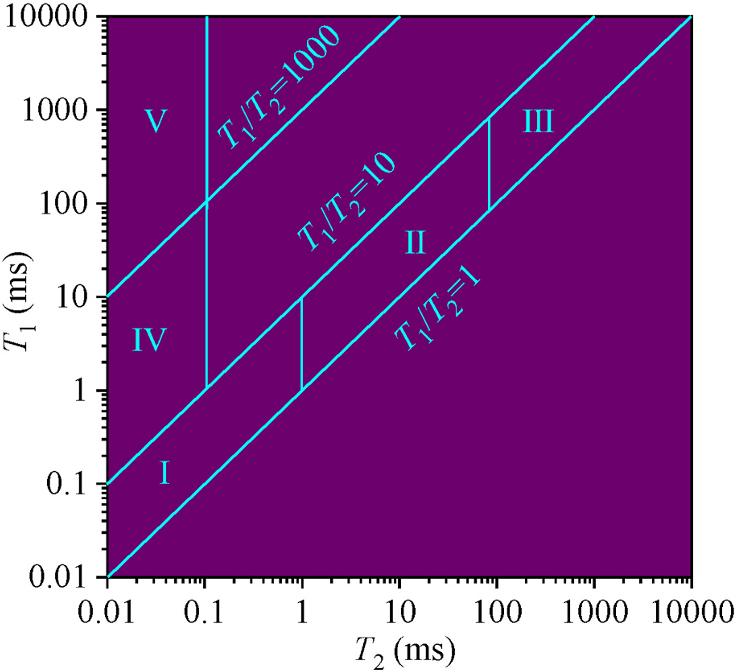
T₁–T₂ hydrogen‑containing species distribution spectrum of cement
1.This figure presents a recognition map constructed by dividing the T₁–T₂ double‑logarithmic coordinate spectrum of the cement hydration system into five regions based on different hydrogen‑containing species.
2.Region I corresponds to liquid water in gel pores and partially bound water; Region II corresponds to free water in capillary pores (T₂: 1–100 ms, T₁/T₂: 1–10); Region III corresponds to surface free water; Region IV corresponds to portlandite‑bound water; and Region V corresponds to ettringite‑bound water.
3.This T₁–T₂ hydrogen‑containing species distribution spectrum effectively delineates the distribution of different components in cement, providing valuable insights for understanding cement hydration kinetics and product formation reactions.
Scientific basis for the 2D component classification model:
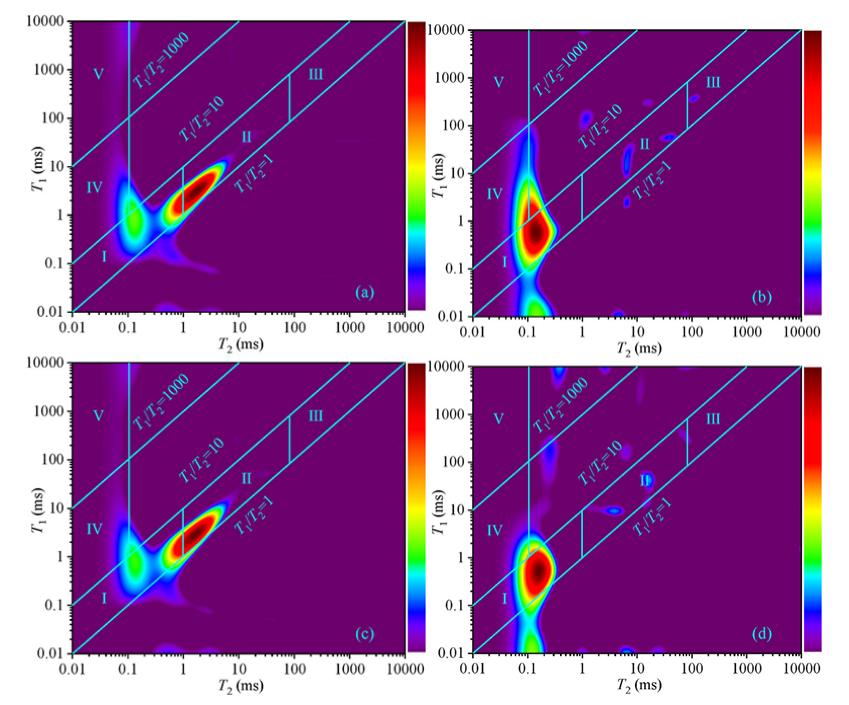
Basis for delineation of T₁–T₂ hydrogen‑containing species distribution spectrum of cement
A high‑temperature heating experiment (heating the sample to 150 °C, holding for 4 hours, then cooling) was conducted to verify the accuracy of the T₁–T₂ hydrogen‑containing species distribution spectrum. After high‑temperature treatment, signals in the region with T₂ > 0.3 ms disappeared, and the T₁/T₂ spectra in Regions II, V, and part of Region I (ratio range 1–10) were no longer visible—indicating that capillary water and ettringite decomposed during heating from 20 °C to 150 °C. Meanwhile, the signal amplitude at T₂ = 0.1 ms decreased significantly, mainly due to the weakening of C‑S‑H‑bound water and evaporation of the monolayer water on pore surfaces. These results confirm the complexity of Region I and validate the previous assignment of Region II (capillary water) and Region V (ettringite). In brief, this figure confirms the validity of material assignments and regional delineation in the T₁–T₂ spectrum through pre‑ and post‑heating comparison.
2D NMR cement hydration component distribution:
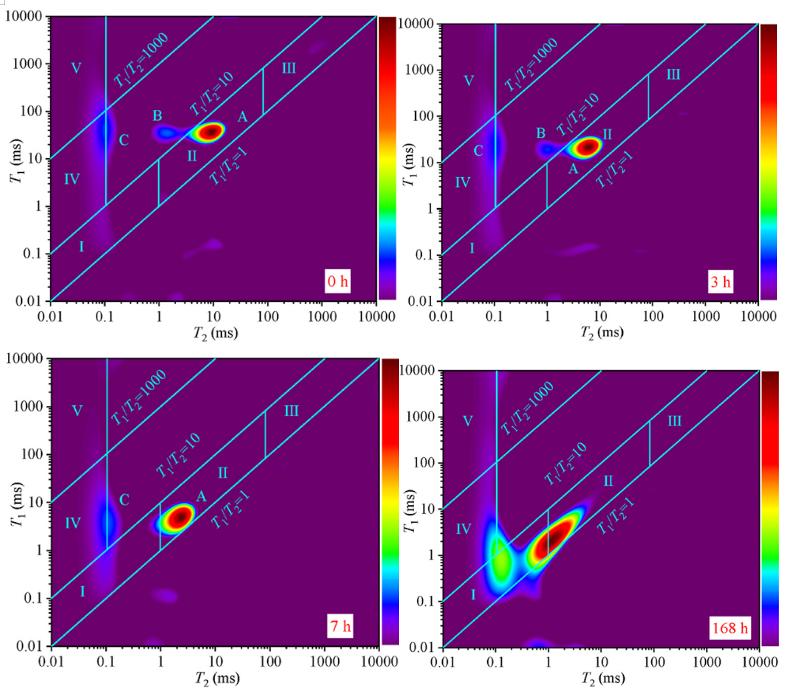
T₁–T₂ spectra of W0.35 cement hydration
This figure shows the evolution of T₁–T₂ spectra during hydration, reflecting the generation and migration patterns of different hydrogen‑containing species:
1.During the first 3 hours of hydration, no significant changes were observed in the T₁–T₂ spectrum. However, when T₂ reached 0.1 ms, a distinct signal appeared in the region where T₁/T₂ > 1 (Peak C), marking the formation of calcium hydroxide and ettringite.
2.Peak B, appearing in the T₁/T₂ ratio range of 10–100, disappeared after 5 hours of hydration for the W0.35 sample. This peak is associated with high concentrations of ions (such as Ca²⁺ and OH⁻) in the early‑stage solution.
3.Between 5 and 24 hours of hydration, hydration products (mainly calcium hydroxide) continued to increase, causing the T₁/T₂ ratio of Peak C to decrease while its signal amplitude increased. Meanwhile, capillary water content decreased, pore size reduced, and gel pore content increased, resulting in a weakening of the CW signal over time and a gradual shift of Peak A toward Region I (the gel pore region).
In brief, T₁–T₂ spectra enable effective real‑time observation of capillary water consumption, gel pore water increase, and formation of solid products such as calcium hydroxide during hydration—corroborating the underlying mechanisms of the hydration reaction.
Recommended Equipment
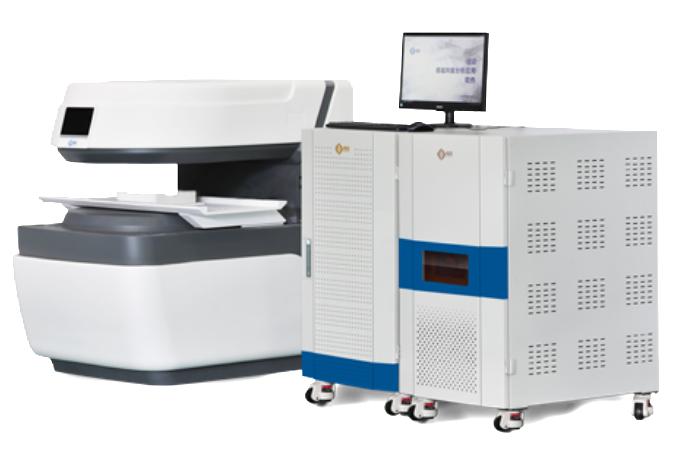
Large‑bore Nuclear Magnetic Resonance Imaging Analyzer
Reference
[1] Zhao Y, Ning L, Bi J, et al. Investigation of the cement hydration process based on 2D nuclear magnetic resonance T₁–T₂ spectrum and entropy theory[J]. Journal of Building Engineering, 2025, 108.
 Scan QR Code
 Scan QR Code
 Phone Support
Phone: 400-060-3233
After-sales: 400-060-3233
 WeChat Support

 Official Account

Back to Top