


01 Industry Pain Points and Technical Background

Crosslinked polymers are key structural materials in the advanced polymer field, with their mechanical strength, thermal stability, and chemical resistance directly related to crosslinking density. Traditional crosslinking process development has long suffered from three major pain points:
Extremely low off‑line testing efficiency – Conventional crosslinking density tests are off‑line methods; samples must cool down after the reaction before testing, failing to capture the dynamic process in real time. Validating a single set of process parameters can take hours to days, significantly lengthening R&D cycles.
Parameter optimization relying on experience – Critical parameters such as reaction temperature, initiator type/dosage, and reaction time depend entirely on trial‑and‑error by engineers, leading to material waste and blind optimization.
Large quality fluctuations in production – Without real‑time monitoring, industrial processes often suffer from under‑crosslinking (sub‑standard performance) or over‑crosslinking (brittleness, thermal aging), resulting in high reject rates and poor batch‑to‑batch consistency.
The research team at Beijing Huairou Laboratory has developed an in‑situ determination method for polymer crosslinking conditions based on low‑field nuclear magnetic resonance (LF‑NMR) , which systematically addresses these pain points. It enables non‑destructive, real‑time, dynamic monitoring of the crosslinking process and rapid quantitative determination of optimal process parameters.
02 Core Technical Solution
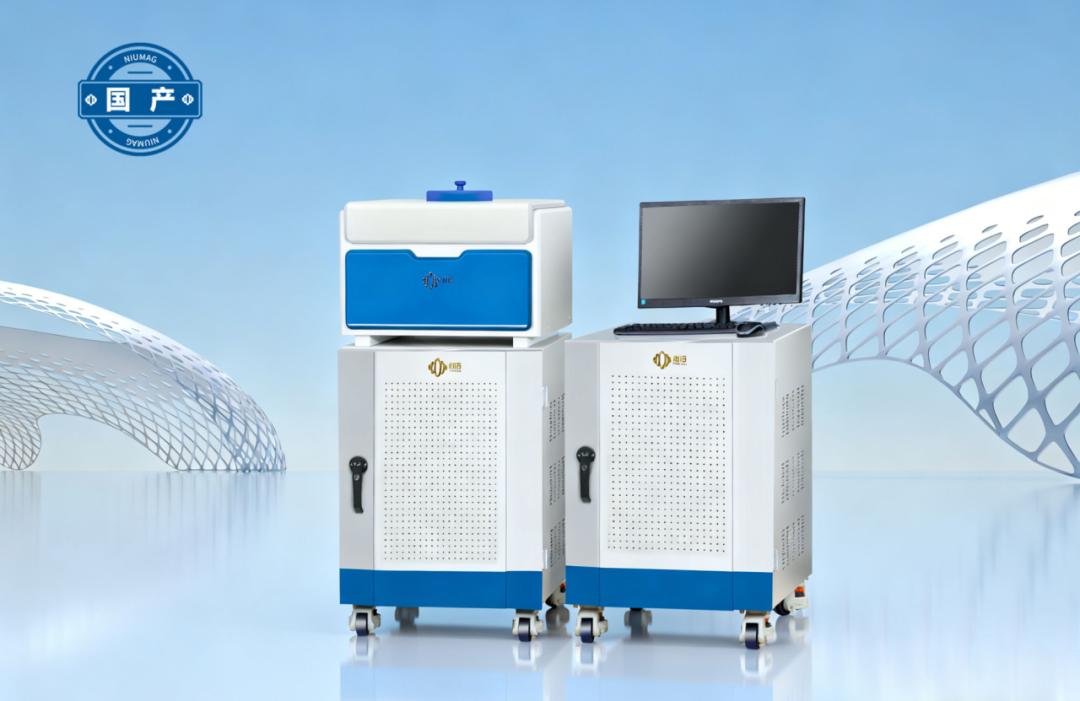
The core concept of this technology is to use a low‑field NMR crosslinking density analyzer to measure the crosslinking density of the sample in‑situ and in real time at different reaction time points during the crosslinking reaction. By constructing crosslinking reaction kinetic curves under various conditions, two key quantitative indicators from the curves allow rapid screening of optimal process conditions:
This method enables systematic investigation of the effects of multiple factors—such as reaction temperature, crosslinking initiator type, initiator dosage, and polymer matrix type—on the crosslinking process, providing a standardized, quantifiable, and reproducible testing protocol for crosslinking process development.
03 Role of Low‑Field NMR Technology: How Does It “See” Crosslinking Density?
Low‑field NMR is the core technology enabling in‑situ crosslinking density measurement. Its detection principle and testing procedure are as follows:
3.1 Core Detection Principle: Relationship Between T₂ Relaxation and Crosslinking Density
LF‑NMR directly measures the transverse relaxation time (T₂) of hydrogen protons in the polymer matrix. The quantitative relationship between T₂ and crosslinking density is straightforward and intuitively understandable:
Higher crosslinking density → polymer chains are more tightly constrained by crosslink points → hydrogen proton mobility is more restricted → shorter T₂ relaxation time.
Lower crosslinking density → polymer chains have higher mobility → hydrogen protons are more free → longer T₂ relaxation time.
The instrument uses the CPMG (Carr‑Purcell‑Meiboom‑Gill) pulse sequence to acquire T₂ decay curves, which are then fitted to a model to directly calculate the absolute crosslinking density, typically expressed in mol/mL.
3.2 In‑Situ Continuous Testing Procedure
The entire testing process is simple and requires no complex sample preparation. The standard procedure is as follows:
Sample preparation: Cut a polymer film containing the crosslinking initiator into test strips of approximately 1 cm × 0.5 cm.
Sample loading and pre‑heating: Place the strip into a dedicated NMR tube, insert it into the test chamber of the LF‑NMR instrument, set the target reaction temperature, and pre‑heat for 1–2 minutes to ensure temperature uniformity.
Automated testing: The instrument automatically emits radio‑frequency pulses at intervals of 20–40 seconds, acquires CPMG echo signals, and fits the data to output the current crosslinking density value.
Curve construction: Continue testing for 300–7200 seconds (5 minutes to 2 hours) to collect crosslinking density data at dozens to hundreds of time points, then fit the data to obtain the crosslinking reaction kinetic curve.
04 Typical Test Results and Parameter Optimization
This method enables rapid quantification of the effects of different process parameters on the crosslinking process. Typical results are presented below.
Optimization of Reaction Temperature:
Using a DCP‑initiated low‑density polyethylene (LDPE) crosslinking system as an example, kinetic curves were tested at three temperatures: 160 °C, 180 °C, and 200 °C.
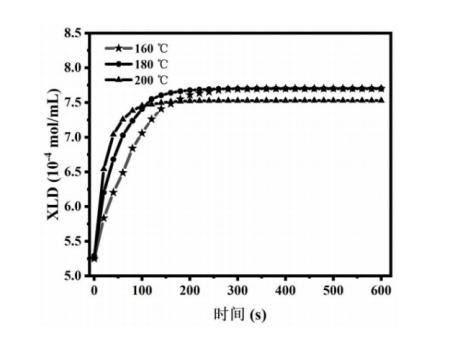
Figure 1: Kinetic curves of polyethylene crosslinking initiated at different temperatures.
Quantitative conclusions are directly drawn from the curves:
160 °C: Reaction rate is too slow; reaching crosslinking equilibrium takes more than 10 minutes, low production efficiency, unsuitable for industrial production.
180 °C: Moderate reaction rate, reaching equilibrium in about 6 minutes, with the highest final crosslinking density – optimal reaction temperature.
200 °C: Fastest initial reaction rate, but rapid initiator decomposition at high temperature leads to increased side reactions, reducing final crosslinking density and posing a risk of thermal aging.
Optimization of DCP Addition Amount:
Crosslinking curves were tested at DCP dosages of 0.5 wt%, 2 wt%, and 5 wt%.
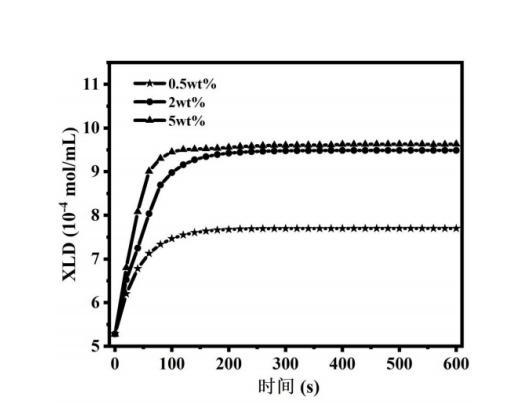
Figure 2: Kinetic curves of polyethylene crosslinking with different initiator dosages.
0.5 wt%: Slow reaction rate, low final crosslinking density, failing to meet performance requirements.
2 wt%: Moderate reaction rate, achieving the highest final crosslinking density.
5 wt%: Faster initial rate, but final crosslinking density is essentially the same as that at 2 wt%, wasting initiator and increasing raw material costs.
Therefore, the optimal initiator dosage is 2 wt%.
Optimization of Other Parameters:
This method can also quickly screen other parameters:
Initiator type screening: Under the same conditions at 180 °C, DCP outperforms DHBP in both reaction rate and final crosslinking density, making it more suitable for polyethylene crosslinking.
Polymer type suitability: Polyethylene crosslinking proceeds smoothly, with crosslinking density continuously rising to equilibrium; polypropylene crosslinking, however, may suffer a decline in crosslinking density at later stages due to thermal degradation, requiring the addition of co‑agents and precise control of reaction termination time.
05 Summary
Industry pain points: Traditional off‑line methods require samples to be cooled before testing after the reaction, fail to observe the reaction process, and rely on empirical trial‑and‑error for process parameter selection.
Solution: Let the polymer react inside the LF‑NMR instrument while continuously measuring crosslinking density, plotting real‑time “crosslinking density vs. time” kinetic curves, and scientifically screen optimal process conditions based on curve slope and plateau value.
Role of technology: LF‑NMR continuously monitors hydrogen proton T₂ relaxation times and converts them into crosslinking density values in real time, acting like an “internal surveillance camera” for the crosslinking reaction – no interruption, no damage, and full data recording.
 Scan QR Code
 Scan QR Code
 Phone Support
Phone: 400-060-3233
After-sales: 400-060-3233
 WeChat Support

 Official Account

Back to Top