
Lignocellulose suffers from limited enzymatic saccharification efficiency due to its complex multi-scale recalcitrance barriers. Hydrothermal pretreatment (HTP), as a mainstream pretreatment technology, can significantly improve the sugar yield, but many challenges remain in mechanism research:
01 Difficulty in characterizing wet-state structure:
Traditional BET and MIP (mercury intrusion porosimetry) require sample drying before testing, which causes pore collapse and cannot reflect the true “hydrated accessibility” of biomass during enzymatic hydrolysis.
02 Limitations of single-scale analysis:
SEM only observes surface morphology, and XRD only measures crystallinity; it is difficult to quantify the effective channels inside the cell wall at the 5–50 nm scale (the size scale of enzymes).
03 Inaccurate quantification of accessibility:
It is not possible to effectively distinguish which pores are active sites accessible to enzymes.
04 Long testing time and poor representativeness:
The traditional solute rejection method (SRA) is cumbersome to operate and cannot monitor in‑situ water dynamics.
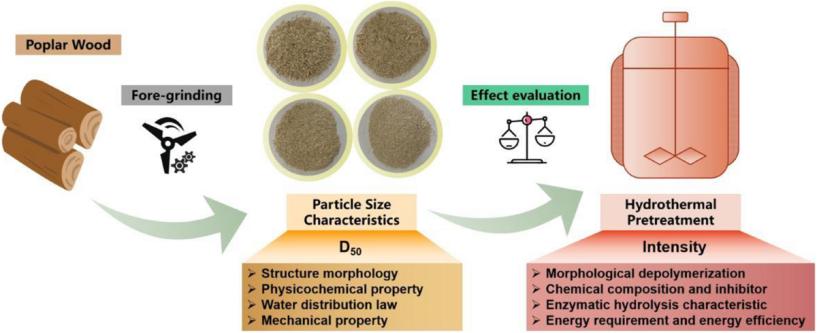
Figure 1 (Graphical Abstract / Process Diagram)
Solution:Multi‑scale, non‑destructive, wet‑state characterization strategy using low‑field NMR
In this study, a low‑field time‑domain NMR (TD‑NMR) instrument (VTMR20 series) from Niumag (NIUMAG) was used. By combining T₂ relaxation analysis with NMR cryoporometry (NMRC), a quantitative logic chain of “pretreatment → microstructure → saccharification performance” was established without destroying the natural hydrated state of the biomass:
The water distribution in hydrothermally pretreated wood was classified into three types:
Using the CPMG sequence of the Niumag TD‑NMR, the study found that the HTP process directly reshapes the water partitioning pattern in wood:
01 Low‑mobility phase (T21 bound water):
As HTP intensity increases, the T21 peak shifts left (shorter relaxation time). This indicates that after hemicellulose removal, the hydrogen bonding between remaining cellulose fibrils becomes stronger, leading to greater water restriction.
02 Key intermediate phase (T22 cell‑wall pore water):
This is a core indicator for evaluating saccharification efficiency. Experimental data show that after HTP, the peak area A22 increases significantly, and the T22 relaxation time extends from a few milliseconds to tens of milliseconds. This proves that the “swelling effect” generated by HTP creates numerous nanoscale pores within the cell wall, greatly increasing the space for water movement.
03 High‑mobility phase (T23 free water):
The increase in A23 reflects the degree of fragmentation of the wood macrostructure by HTP: particle size decreases, exposing more external surface area.
Technical value:
The evolution of the T22 component directly quantifies the “opening degree” of the cell wall, providing an intuitive physical criterion for screening pretreatment processes.
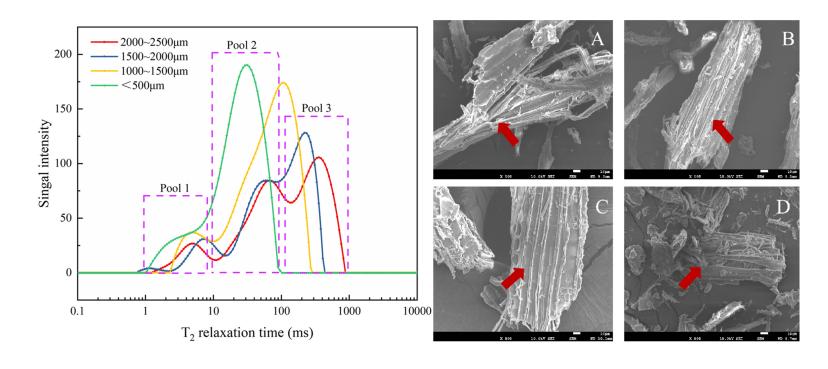
Figure 2 (T₂ relaxation spectra) and Figure 3 (SEM images)
Using the NMR Cryoporometry technique on the Niumag instrument, by monitoring the phase transition (melting process) of water inside the pores, the pore size distribution of wet‑state wood was accurately characterized:
01 Pore size distribution (PSD) shift:
In the control group (native wood), the pore size was mainly <5 nm. After HTP, the pore volume in the range of 5–50 nm increased significantly. Since the hydrodynamic diameter of cellulase is about 5.1 nm, pores in this range represent the “effective channels” for enzymatic hydrolysis.
02 Quantification of effective accessibility:
The effective pore volume calculated by integrating NMR curves shows a strong linear correlation (R² > 0.95) with the final enzymatic sugar yield.
03 Multi‑scale complementarity:
Combined with XRD, it was found that although HTP may increase cellulose crystallinity (which is generally unfavorable for enzymatic hydrolysis), the substantial increase in accessibility measured by LF‑NMR compensates for this deficiency. This indicates that for hydrothermally pretreated wood, pore accessibility is the primary factor governing saccharification efficiency, rather than crystallinity.
Technical value:
NMRC fills the gap that traditional characterization cannot measure “wet‑state effective pore size”, providing key evidence for elucidating enzymatic recalcitrance.
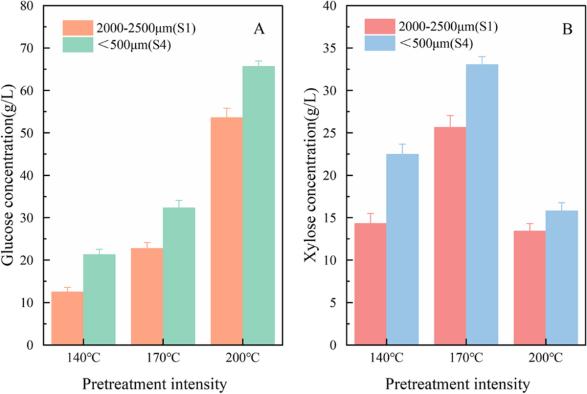
Figure 4 – Glucose Yield
01 Establishing a predictive correlation between microscopic indicators and biochemical yield
The study proves that the total T₂ spectral area and the T22 peak value measured by Niumag LF‑NMR can be directly used as “fingerprint indicators” for predicting saccharification efficiency. Using these parameters, the pretreatment effect can be predicted in just 2 minutes of testing before a 72‑hour enzymatic hydrolysis experiment, greatly shortening the R&D cycle.
02 Building an in‑situ characterization system under real conditions
This technical system solves the problem of “dry‑state vs. wet‑state inconsistency” in biomass research. Low‑field NMR testing requires no complex sample preparation, has good repeatability, and low inter‑day variation, achieving a technical leap from “static morphological observation” to “dynamic kinetic quantification”.
03 Constructing a complete picture of multi‑scale structure
The combination of Niumag low‑field NMR and high‑field NMR provides information at both the molecular scale (crystallinity, chemical bonds) and the supramolecular scale (pore distribution, hydrated accessibility), offering a full‑scale solution for wood science research.
Reference
《Evaluation of initial material particle size on the hydrothermal pretreatment of poplar powder》
 Scan QR Code
 Scan QR Code
Phone: 400-060-3233
After-sales: 400-060-3233


Back to Top