
Coalbed methane (CBM) exists mainly in the adsorbed state on the micropore surfaces of the coal matrix. The adsorbed gas content often exceeds the pore volume, a phenomenon that cannot be explained by free or dissolved gas alone. Therefore, adsorbed gas is the primary research focus.
The extraction of CBM must go through the process of “water drainage – pressure depletion – desorption – diffusion – seepage” to convert adsorbed gas into free gas for production. This unique occurrence mode determines the critical role of adsorption‑desorption behavior in CBM recoverability. Early studies commonly used the Langmuir monolayer adsorption model to describe isothermal adsorption, but significant deviations occur under high pressure, water‑bearing conditions, and multi‑component gas systems. Hysteresis is widespread, and traditional models cannot accurately describe adsorption‑desorption dynamics in actual reservoirs. Reversibility of adsorption‑desorption is a fundamental characteristic of physical adsorption, meaning that during pressure depletion, adsorbed gas can be converted into free gas for production. Understanding the reversibility pattern helps determine the critical desorption pressure, optimize depletion strategies and well patterns, and thereby increase single‑well production and recovery factor.

Low‑field nuclear magnetic resonance (LF‑NMR) technology has significant scientific and engineering value in characterizing the reversibility of CBM adsorption‑desorption. Its main advantages include:
01 Non‑destructive, in‑situ measurement: No sample crushing is required, so the original coal structure and stress state are preserved. The measurement results are much closer to actual formation conditions, avoiding errors introduced by sample preparation in traditional methods.
02 Simulation of deep formation conditions: With a temperature‑pressure control system, experiments can be carried out under simulated formation temperature, confining pressure, and fluid injection conditions, providing reliable data support for deep CBM development.
03 Fast, dynamic monitoring: While traditional volumetric methods take hours to days, low‑field NMR can complete a measurement in minutes and continuously track the entire adsorption‑desorption process, capturing transient changes.
04 Revealing micro‑scale adsorption‑desorption mechanisms: Low‑field NMR can distinguish between adsorbed and free methane as well as the water phase at the molecular level. By dynamically monitoring the adsorption and desorption of gas on pore surfaces using the T₂ relaxation spectrum, researchers can understand the gas‑coal‑water interaction mechanisms.
The following case study illustrates the use of NMR to characterize methane adsorption/desorption and CO₂ competitive adsorption in coal.
Experimental Method:
The sample holder pressure was maintained at 14 MPa and the temperature at 40 °C to simulate a deep coal seam. The experiment consisted of three stages: CH₄ adsorption saturation, pressure reduction desorption, and CO₂ injection.
Specific steps for the sample experiment:
01 Dry the sample in an oven at 110 °C for 12 hours.
02 Place the cylindrical sample into the holder.
03 Inject CH₄ into the sample chamber at pressures of 2, 4, 6, 6.5, 7, 8, 9 and 10 MPa until the coal sample is saturated. Once the NMR signal reaches a steady state (typically about 1.5–2 hours), the coal sample is considered to have reached “surface adsorption equilibrium”.
04 Reduce the pressure in the sample chamber to 9, 8, 7, 6.5 and 6 MPa, and continuously measure the NMR spectrum at each pressure point until adsorption equilibrium is reached.
05 Inject CO₂ gas at set pressures of 6, 8, 10 and 12 MPa into the sample chamber, and test the NMR spectrum at each pressure point until equilibrium is reached. The above procedure is repeated as the CO₂ pressure increases up to 12 MPa.
Results and Analysis:
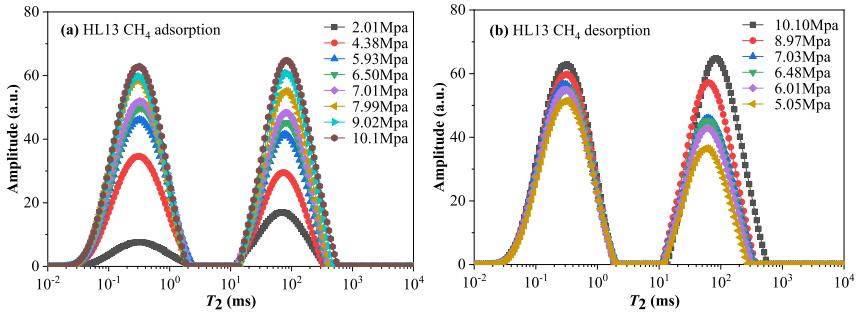
*Figure 1: T₂ spectra of methane adsorption/desorption for HL13 coal sample.*
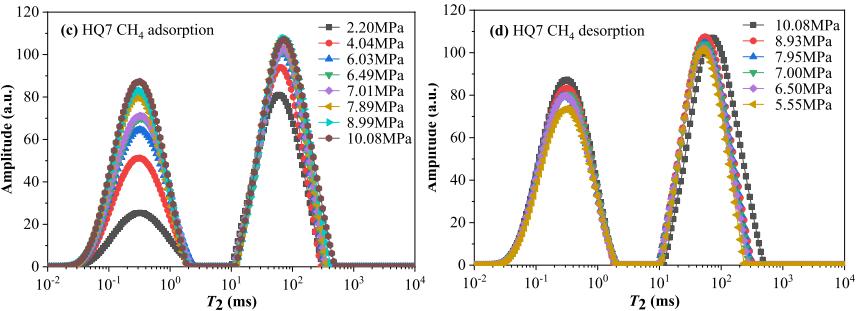
*Figure 2: T₂ spectra of methane adsorption/desorption for HQ7 coal sample.*
The T₂ distributions of methane adsorption (pressurization) and desorption (depressurization) for the two selected coal samples are shown in Figures 1 and 2. The methane relaxation spectra exhibit two distinct peaks, labeled P1 and P2 from left to right. The P1 peak appears in the range 0.01–3 ms, showing slower relaxation, while the P2 peak appears in the range 10–100 ms. Protons in larger pores generally show slower relaxation than those in smaller pores. Therefore, the P1 peak can be assigned to methane adsorbed on coal pore surfaces, and the P2 peak to free methane present in the coal fracture system.
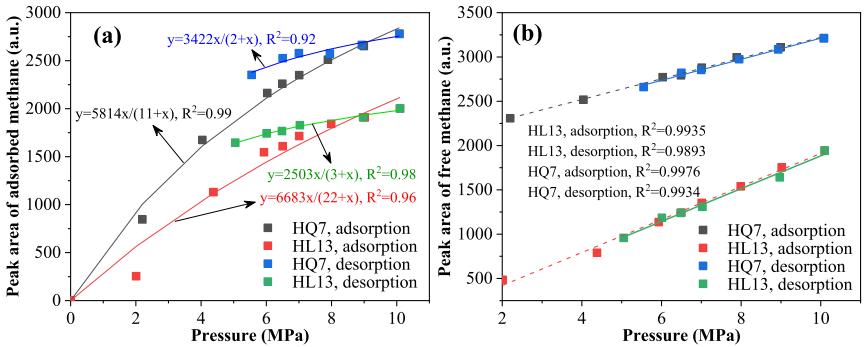
Figure 3: Correlation between sample peak area measured by NMR and equilibrium pressure during adsorption and desorption.
Figure 3 shows the relationship between adsorbed peak area and methane equilibrium pressure. For the HL13 and HQ7 samples, the adsorption peak areas at 10 MPa are 7.89 times and 3.29 times, respectively, those at an initial equilibrium pressure of 2 MPa. In Figure 3b, the P2 peak fitting curves for the two samples are almost identical, indicating that free methane exhibits nearly reversible behavior in both processes.
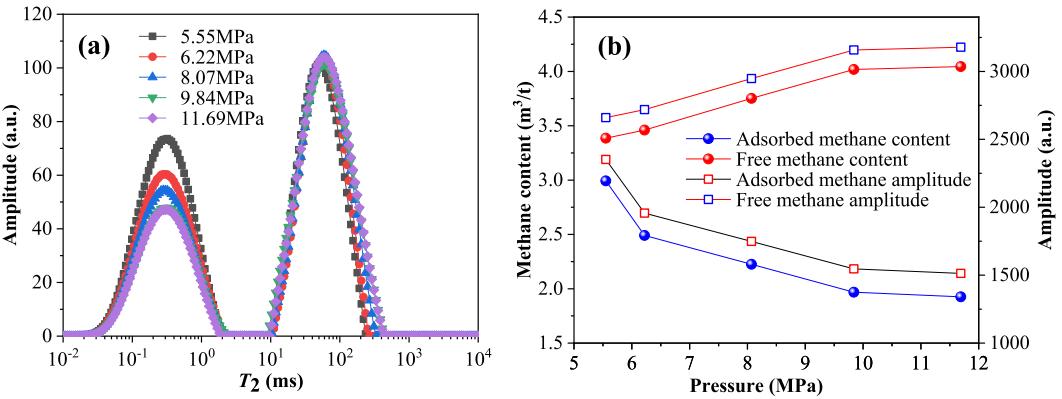
Figure 4: Changes in methane T₂ spectra and content during CO₂ displacement.
Figure 4 shows the dynamic changes in NMR T₂ spectra and methane content for the HQ7 sample during CO₂ injection. Upon initial CO₂ injection (pressure 6.22 MPa), part of the adsorbed methane is desorbed as seen from the T₂ spectral changes in Figure 4a. According to Figure 4b, the amount of adsorbed methane decreases rapidly, with the initial desorbed gas accounting for about 47.06% of the total desorbed content. As pressure increases, the decrease in adsorbed gas slows down significantly. This finding provides guidance for using CO₂ competitive adsorption to enhance coalbed methane recovery.
Recommended Equipment
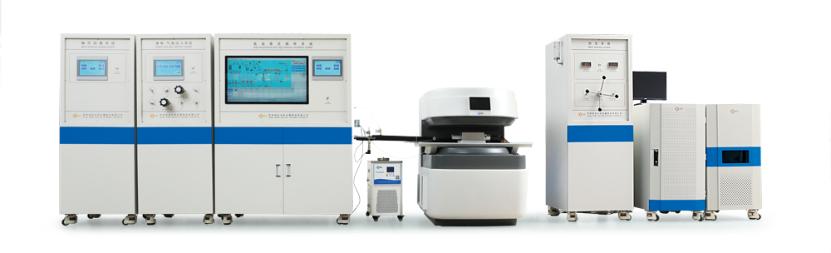
Large‑bore Nuclear Magnetic Resonance Imaging Analyzer
Reference
[1] Xu H, Ni J, Ding H, et al. Methane adsorption/desorption and carbon dioxide replacement in low permeable coal using LF‑NMR – experiments on cylindrical sample under apparent adsorption equilibrium condition[J]. International Journal of Greenhouse Gas Control, 2024, 132.
 Scan QR Code
 Scan QR Code
Phone: 400-060-3233
After-sales: 400-060-3233


Back to Top