

In the wave of green transformation in infrastructure construction, “soil-ceramsite,” as a low-carbon and environmentally friendly novel material, is gradually replacing traditional stabilizers such as cement and lime to become the mainstay of subgrade improvement and foundation reinforcement. During the stabilization process, soil-ceramsite fills micropores and forms a structural skeleton, thereby significantly enhancing the shear strength and durability of the soil and reconstructing the internal water distribution. So, how does soil-ceramsite alter the physicochemical properties of soil at the microscopic level? And what changes occur in the pore water distribution characteristics after such stabilization?
Compared with traditional soil moisture testing methods such as oven‑drying and infrared techniques, low‑field nuclear magnetic resonance (LF‑NMR) technology offers the advantages of being non‑destructive, rapid, and accurate. It can provide precise water content results within minutes and characterize the internal water distribution of soil. In addition, LF‑NMR can characterize pores from nanometer to millimeter scales across the full pore size range, and can monitor the real‑time dynamic water distribution during phase changes under different environments (drying, saturation, pressurization, etc.).
Research based on NMR technology for soil‑ceramsite improved soil not only reveals the evolution of microscopic pore water distribution characteristics but also provides a solid theoretical basis for optimizing stabilizer formulations and predicting long‑term soil performance.
Research Case
Pore Water Distribution Characteristics of Soil During Compaction, Saturation, and Drying Processes Based on Low‑Field NMR
01 Sample Preparation and Testing
Sample source: The soil used in the experiment was silty clay collected from the Yanqing District of Beijing, China.
Pretreatment: The soil samples were first dried at 105 °C, then cooled in sealed bags for later use.
Sample preparation: Specimens were prepared using PTFE cutting rings (inner diameter 45.0 mm, height 20.0 mm). The preparation scheme covered combinations of different compaction degrees (80%, 85%, 90%, 95%, 100%) and different initial water contents (12%, 16.5%, 20%).
Pore water distribution (PWD) measurement: PWD was measured using low‑field nuclear magnetic resonance (LF‑NMR) technology. The core of the method is to convert the NMR‑measured T₂ spectrum into a pore water distribution curve with clear physical meaning.
02 Experimental Conclusions
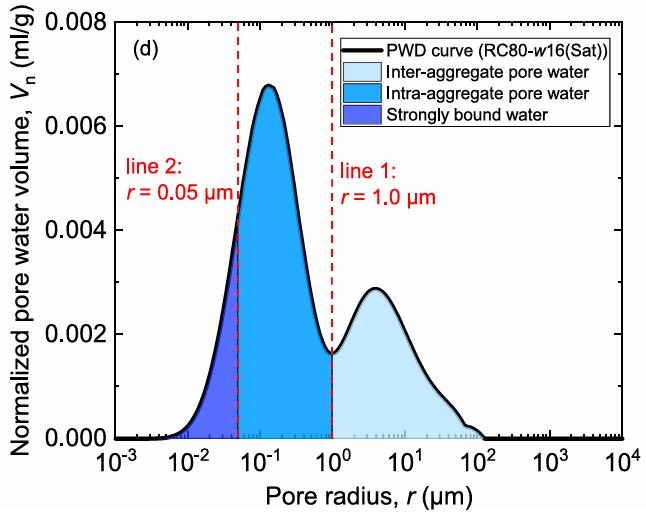
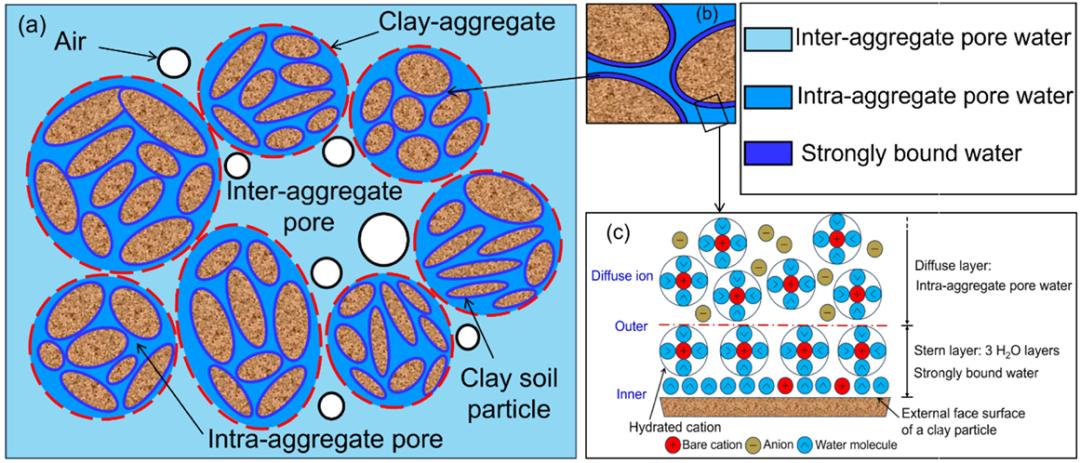
Figure 1 Pore water distribution model for different water types.
Figure 1 – Classification of water types based on NMR:
The distribution model clearly shows the locations of different water components within the soil.
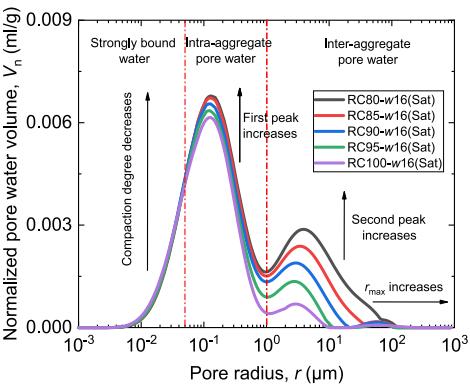
Figure 2 Pore water distribution curves of saturated compacted specimens.
Figure 2 shows the pore water distribution characteristics of saturated compacted specimens under different compaction degrees. The results indicate that as the compaction degree increases, the pore water content generally shows a decreasing trend. This demonstrates that during compaction, the pore space of the soil is compressed, leading to a reduction in pore water content.
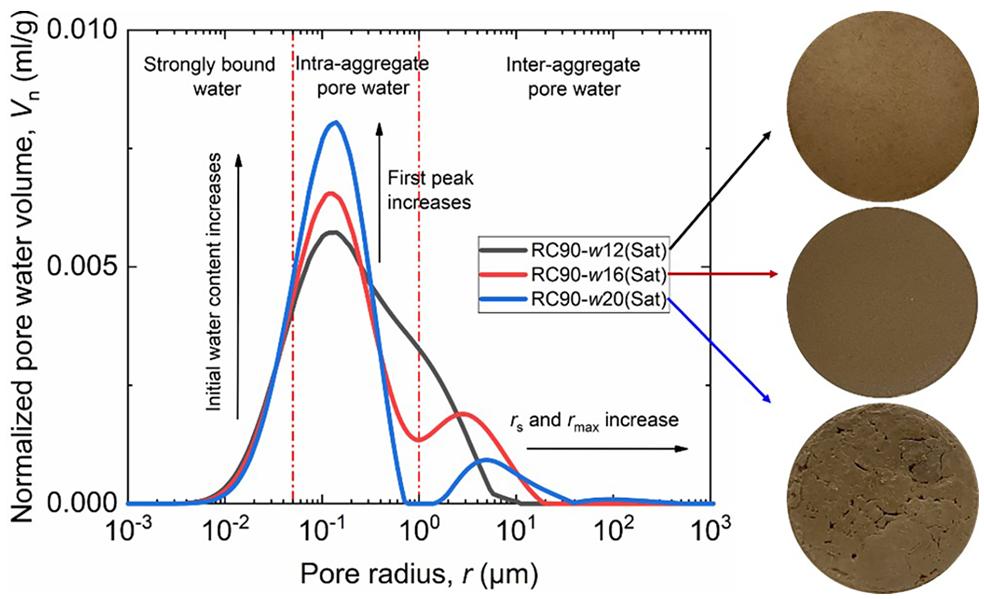
Figure 3 Water distribution characteristics of saturated compacted specimens under different initial water contents.
Figure 3 shows that at a lower initial water content (w12), the curve exhibits a unimodal shape, indicating that soil particles have not yet sufficiently aggregated to form aggregate structures. When the initial water content increases to w16 and w20, the curve transforms into a bimodal shape, marking the formation of aggregates and the coexistence of typical “intra‑aggregate pores” and “inter‑aggregate pores” – a binary structure.
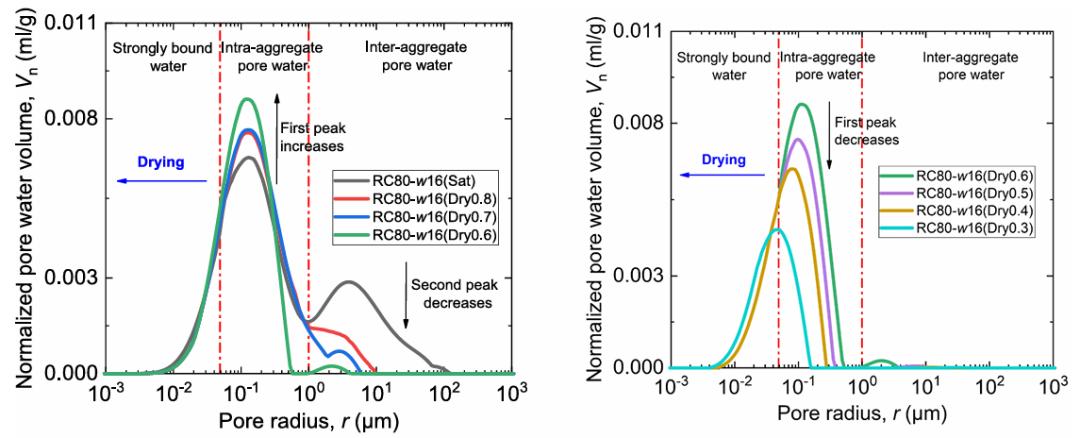
Figure 4 Dynamic evolution of pore water distribution during soil drying (a, b).
Figure 4 presents two stages of the soil drying process based on NMR technology:
This case study uses low‑field NMR technology to classify water components in soil and investigate their distribution characteristics during compaction, saturation, and drying processes, thereby providing support for characterizing the pore water distribution of soil improved with soil‑ceramsite.
Reference
[1] Zhao Y X, Wu L Z, Li X. NMR‑based pore water distribution characteristics of silty clay during the soil compaction, saturation, and drying processes[J]. Journal of Hydrology, 2024, 636(000): 12.
Recommended Equipment
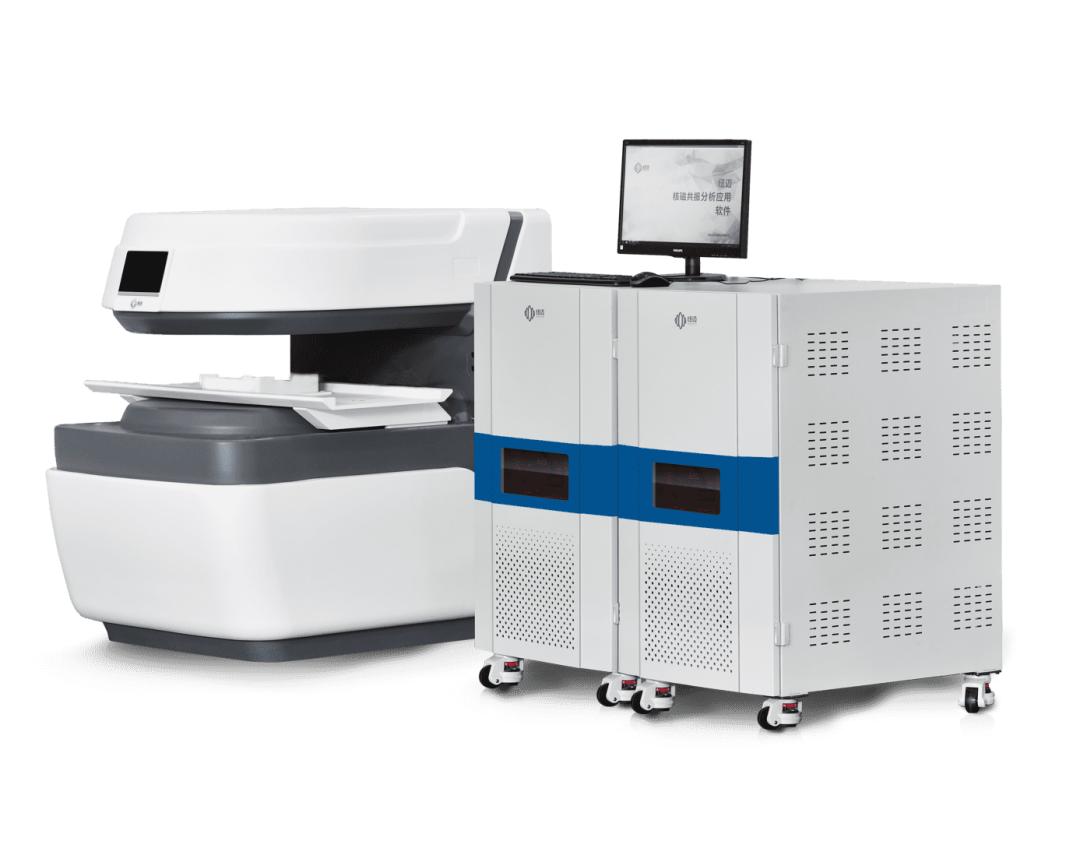
MacroMR12-150H-I
 Scan QR Code
 Scan QR Code
 Phone Support
Phone: 400-060-3233
After-sales: 400-060-3233
 WeChat Support

 Official Account

Back to Top