
The rapid development of industry and population has led to increasingly severe environmental pollution. Hexavalent chromium Cr(VI) is one of the common heavy metal pollutants in industrial wastewater, widely present in industries such as textile manufacturing, leather tanning, paint production, steel manufacturing, and oil refining. Furthermore, Cr(VI) is highly toxic and can cause mutations, carcinogenesis, and other serious health issues in living organisms. The World Health Organization has set the maximum permissible concentration of Cr(VI) in drinking water at 0.05 mg/L. Photocatalytic technology utilizing solar-to-chemical energy conversion is considered a clean and efficient method for reducing Cr(VI) to Cr(III), and a highly efficient and stable catalyst is the key to this technology.
Graphitic carbon nitride (g-C3N4) is a new non-metallic semiconductor photocatalyst that has excellent visible light responsiveness, easy preparation, low cost, environmental friendliness, and good chemical stability, making it highly suitable for catalyzing solar-to-chemical energy conversion reactions. However, its limited light absorption range (200-450 nm) and low quantum yield restrict its practical application potential. Therefore, researchers have proposed several methods to improve the performance of g-C3N4 and other semiconductor photocatalysts, such as semiconductor composites, doping, and loading precious metals as co-catalysts. Among these methods, loading precious metal (e.g., Pt, Au, Pd) nanoparticles onto g-C3N4 is a promising strategy to enhance photocatalytic activity.
In addition to developing high-performance photocatalysts, improving detection methods is also worth attention, and low-field NMR has made its contribution in this study.
20 mg of the catalyst was uniformly dispersed in 50 mL of a 20 mg/L K2Cr2O7 solution, and 0.165 mL of 100 mg/mL citric acid was added as a hole sacrificial agent. The mixed solution was magnetically stirred in the dark for 0.5 hours to allow the catalyst to reach adsorption-desorption equilibrium with Cr(VI). The solution, after dark treatment, was placed under a 300W xenon lamp (Beijing BoFeiLai PLS-SXE300/300UV model) with a cutoff filter (λ > 420 nm) to simulate visible light for photocatalysis. During the visible light irradiation, 1 mL of the reaction solution was taken from the reactor at given intervals, filtered through a 0.45 μm PTFE membrane, and the Cr(VI) concentration was measured using an improved diphenylamine-based uracil (DPC) colorimetric method at the maximum absorption wavelength of 540 nm using a UV-2700 UV-visible spectrophotometer.

Figure 1: Schematic Diagram of In Situ LF-NMR Monitoring of the Photocatalytic Cr(VI) Reduction Process. CB: Conduction band of semiconductor catalyst; VB: Valence band of semiconductor catalyst
The single-component Cr(III) system or the mixed-component (VI)-Cr(III) system was added to a specially made NMR sample tube, along with Ag/g-C3N4 catalysts (1Ag/g-C3N4, 2Ag/g-C3N4, 5Ag/g-C3N4, and 10Ag/g-C3N4). The sample tube was placed in an NMR spectrometer, with light being fed into the sample tube via an optical fiber, and in situ LF-NMR detection was conducted.
LF-NMR Analysis (NMR Spectrometer, optional temperature variation function (-100°C to 200°C), Suzhou Newmai Analysis Instruments Co., Ltd.), magnetic field strength of 0.5±0.08T, proton resonance frequency of 21.3 MHz, with the CPMG sequence used for testing.
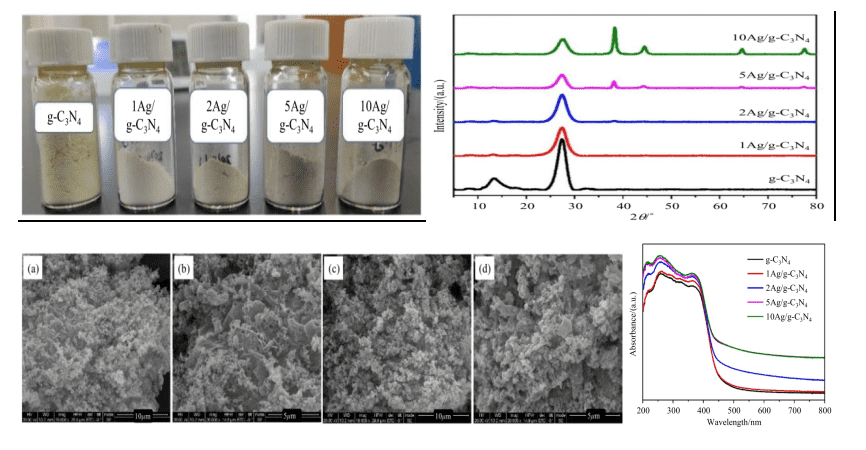
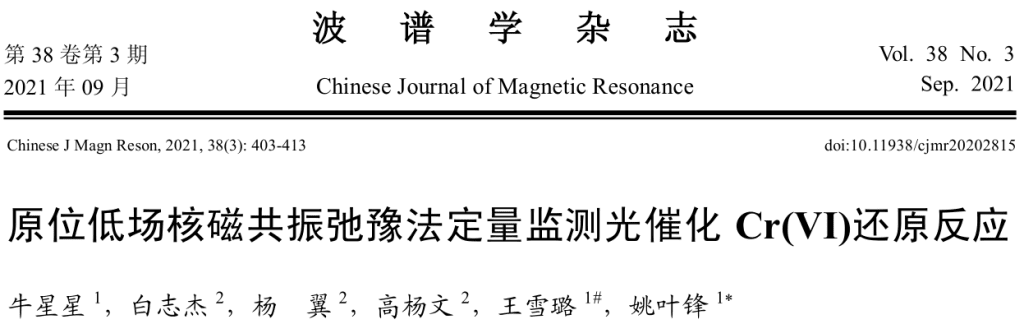
Figure 2: Sequential optical photos, XRS spectra, SEM images, and UV-Vis absorption spectra of the composite photocatalyst with different Ag loadings
The catalyst’s bulk phase structure and optical properties were analyzed using characterization techniques such as XRD spectra, SEM testing, and UV-Vis absorption spectra. It was found that the absorption edge of pure g-C3N4 is around 460 nm, consistent with its 2.7 eV bandgap. Compared with pure g-C3N4, the composite photocatalyst loaded with Ag nanoparticles showed significantly increased visible light absorption intensity, and the absorption edge shifted noticeably to the red, thus broadening the catalyst’s visible light response range. As the Ag loading increased, both the red-shift degree and visible light absorption intensity also increased. Therefore, the composite photocatalyst can more effectively absorb solar energy, generating more photo-generated electrons and holes to enhance photocatalytic activity.

Figure 3: (a) CMPG decay curve of the Cr(III) system, (b) T2 and (c) 1/T2 as a function of Cr(III) ion concentration (1-20 mg/L)
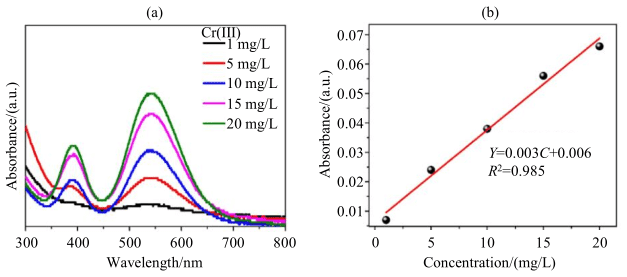
Figure 4: (a) UV-Vis absorption spectrum of Cr(III) system and (b) absorbance as a function of Cr(III) ion concentration
Figure 3(a) shows the CMPG decay curve of the single-component Cr(III) solution at different concentrations (1-20 mg/L). The proton CPMG signal’s signal-to-noise ratio (SNR) was relatively high at a field strength of around 0.5T. Figure 3(b) shows the T2 value variation curve of the above solution. As the concentration of paramagnetic Cr(III) ions in the system increased, the T2 value of the system showed a decreasing trend. Figure 3(c) demonstrates a good linear relationship between 1/T2 and Cr(III) ion concentration.
To further verify the accuracy of the above analysis, the author conducted further analysis using traditional UV spectrophotometry. Figure 4(a) shows the UV-Vis absorption spectrum of the Cr(III) single-component system as a function of Cr(III) concentration, with EDTA as the colorant. The absorption wavelength of the Cr(III)-EDTA complex is around 550 nm. Figure 4(b) presents the fitting curve of absorbance as a function of Cr(III) ion concentration for the above system. It can be seen from Figure 4(b) that, within the tested concentration range, there is a good linear relationship between absorbance and Cr(III) concentration. Therefore, the LF-NMR relaxation method based on T2 can be validated for analyzing the variation in the concentration of paramagnetic Cr(III) ions with high accuracy.
Figure 5: (a) CMPG decay curve of Cr(VI)-Cr(III) mixed system, (b) T2 and (c) 1/T2 as a function of ion concentration (Cr(VI)-Cr(III) concentration gradient from 20-0 mg/L to 0-20 mg/L)
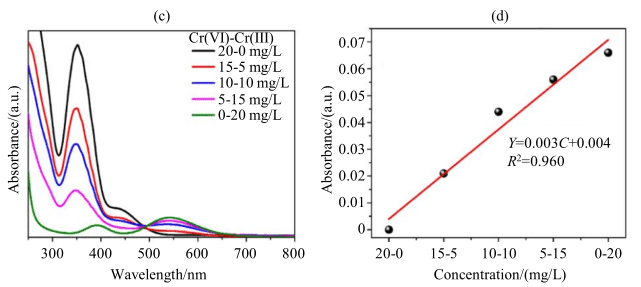
Figure 6: (c) UV-Vis absorption spectrum and (d) absorbance change as a function of Cr(III) ion concentration in the Cr(VI)-Cr(III) mixed system (Cr(VI)-Cr(III) concentration gradient from 20-0 mg/L to 0-20 mg/L)
To better reflect the changes in Cr(VI) and Cr(III) in the photocatalytic reaction system, the author conducted a study on the mixed-component system. Figure 5(a) shows the CMPG decay curve of the mixed-component system. It can be seen from Figure 5(a) that the proton CPMG signal’s SNR in the mixed-component system is also relatively high, indicating that the change in the system does not affect the testing. Figure 5(b) shows that as the ion concentration gradient in the mixed system changes from 20-0 mg/L to 0-20 mg/L, the T2 value of the system also decreases. Figure 5(c) shows that 1/T2 in the mixed system exhibits a good linear relationship with the Cr(III) ion concentration.
To further verify the accuracy of the above analysis, the author used traditional UV spectrophotometry for further analysis of the system. Figure 6(c) shows the UV-Vis absorption spectrum of the mixed-component system as a function of ion concentration using the same colorant method. The absorption peak at 350 nm corresponds to Cr(VI), and the absorption peak at 550 nm corresponds to the Cr(III)-EDTA complex. As shown in Figure 6(c), the absorption peaks of Cr(VI) and Cr(III)-EDTA are far apart, and the absorption of Cr(VI) does not affect the absorption of Cr(III)-EDTA. Figure 6(d) shows the fitting curve of absorbance change with Cr(III) ion concentration in the mixed-component system. It matches the results for single-component systems, showing a good linear relationship between absorbance and Cr(III) ion concentration, further validating the conclusions obtained by LF-NMR relaxation, and proving the feasibility of LF-NMR relaxation method for monitoring the photocatalytic Cr(VI) reduction reaction.
Table 1: T2 values and absorbance measured by LF-NMR relaxation method and UV-Vis spectrophotometry for Cr(III) and Cr(VI)-Cr(III) mixed systems
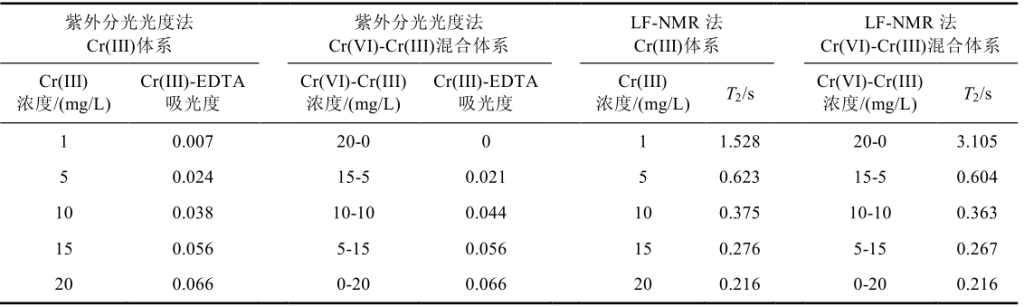
Whether using LF-NMR relaxation or traditional UV spectrophotometry, the results for both single-component and mixed-component systems (T2 values and absorbance, as well as the relationship between both and the concentration of paramagnetic Cr(III) ions in the solution) are very similar, indicating that Cr(VI) in the mixed-component system has almost no effect on the determination of Cr(III). In both the single-component and mixed-component systems, the concentration of paramagnetic Cr(III) ions showed a good linear relationship with 1/T2, demonstrating that LF-NMR relaxation can be used to characterize the changes in Cr(III) concentration. This indicates that LF-NMR relaxation can be applied to monitor photocatalytic Cr(VI) reduction reactions and evaluate the performance of photocatalytic Cr(VI) reduction with high precision.
This article successfully loaded Ag nanoparticles onto g-C3N4 using sodium borohydride reduction to prepare Ag/g-C3N4 composite photocatalysts. Compared to pure g-C3N4, the photocatalytic activity for Cr(VI) reduction was greatly improved, and 5Ag/g-C3N4 exhibited the best photocatalytic activity. Furthermore, the study confirmed the feasibility of using LF-NMR relaxation to monitor photocatalytic Cr(VI) reduction reactions. This method can quantitatively analyze the concentration of paramagnetic Cr(III) ions in the reaction solution based on the system’s T2 values. Compared to traditional UV-visible spectrophotometry, LF-NMR relaxation offers advantages such as simplicity, speed, low cost, and no need for sample pretreatment, providing a new approach for evaluating photocatalytic Cr(VI) reduction and other heavy metal ion reduction processes.
Niuxingxing, Baizhijie, Yang Yi, et al. In Situ Low Field NMR Relaxation Method for Quantitative Monitoring of Photocatalytic Cr(VI) Reduction Reaction[J]. Journal of Spectroscopy, 2021, 38(3):11.

 Scan QR Code
 Scan QR Code
Phone: 400-060-3233
After-sales: 400-060-3233


Back to Top