
1. The Impact of Fractures on Recovery in Low-Permeability Rocks – Abstract
Hydraulic fracturing can significantly enhance crude oil production from tight formations, and understanding how fractures influence pore-scale recovery is a key research focus. The pore structure of rocks changes during fracturing, particularly in laboratory-created fractures, affecting mass transfer between matrix pores and fractures. These changes must be considered to accurately evaluate the effect of fractures on fluid migration; direct comparisons of pre- and post-fracture samples can be misleading. In this study, deuterium oxide and guar gum were used to fill fractures. This filler does not invade the matrix pores and produces no detectable NMR signal. By testing samples with this filler and comparing them with unfilled samples, fracture-specific NMR characteristics can be identified. This allows subsequent N₂ and CO₂ huff-and-puff experiments to isolate and eliminate fracture effects, enabling analysis of fracture-matrix fluid transport mechanisms in a dual-porosity system.
(Low-field NMR analysis) experimental results indicate:
1) Fractures reduce gas sweep efficiency. This can be partially mitigated by injecting N₂ instead of CO₂, as N₂ elastically supports small pores, although the total recovery from pure N₂ huff-and-puff remains significantly lower than that from CO₂.
2) Filling fractures increases pore recovery efficiency.
2. Experimental Equipment and Methodology
This study used the Newmark low-field NMR core analysis system (medium-sized NMR imaging analyser), as shown in Figure 1.

Figure 1. Medium-sized NMR Imaging Analyser (Low-field NMR Core Analysis System)
Low-field NMR monitoring of gas huff-and-puff recovery.
1) Saturated oil matrix core gas huff-and-puff experiments (Dong, 2020a, 2020b);
2) Fractured core gas huff-and-puff experiments, with Brazilian Disc Method (BDM) fracture creation, to determine post-fracture total pore distribution;
3) Filled-fracture core gas huff-and-puff experiments using deuterium oxide and guar gum filler, to determine fracture distribution and content.
Initial NMR T₂ curves for the four samples are shown in Figure 2.

Figure 2. Pre-fracture T₂ spectra of saturated light oil samples (J-1 & J-2 from Jimsar Sag, J-3 & J-4 from Xihu Sag)
3. Low-field NMR Experimental Results
1) Fracture distribution (low-field NMR analysis)
Using guar gum filling experiments, the full T₂ distribution of opened fractures was obtained (T₂ spectrum orange-filled area, Figure 3). Newly appearing larger fractures are seen on the right side of the T₂ spectrum, while micro-fractures extend to T₂ ≈ 1 ms. Fracturing alters matrix pore structure (M0 vs. G0), with amplitude and boundary changes varying. Clearly identifying fractures and matrix pore distribution helps accurately evaluate their impact on fluid transport.

Figure 3. T₂ distribution of fractures (Q1 & Q2 indicate boundaries of large, medium, and small pores)
2) Pore volume increase pre- and post-fracturing
Pore volume change rates before and after fracture filling were calculated (Figure 4). PVF (blue) reflects overall pore improvement by fracturing, while PVG (red) represents matrix pore conversion to fractures. For micro-porous cores (J-1 & J-2), total pore improvement is more significant but matrix-to-fracture conversion is low. For macro-porous cores (J-3 & J-4), total pore improvement is moderate but matrix-to-fracture conversion is higher. PVF was calculated by comparing cumulative NMR signals of M0 and F0; PVG by comparing M0 and G0.

Figure 4. Pore volume changes before and after fracture filling
3) Effect of fracture filling on fluid flow (low-field NMR analysis)
Fracturing alters matrix pore structure, so pore size classification methods based on original samples are no longer applicable. Here, pores are divided into large, medium, and small based on fracture size tertiles to calculate pore characteristics (e.g., medium pores Q1).

Figure 5. T₂ spectra for gas huff-and-puff in fractured cores (‘G6 N₂-CO₂’ is the sixth N₂-CO₂ cycle for filled sample G0)
Using pre-fracture M0 recovery as a baseline, incremental recovery Ru under fracture and gas combinations was compared (Figure 6). N₂-CO₂ injection in matrix cores M0 outperformed pure CO₂ (grey, Dong, 2020a). Compared with pure CO₂ huff-and-puff, N₂-CO₂ injection in fractured samples improved recovery in micro-porous cores (J-1 & J-2) but was less effective in macro-porous cores (J-3 & J-4), likely due to N₂ providing elastic support to small pores. Fractures store large amounts of gas, especially CO₂, reducing gas diffusion in matrix pores and lowering total recovery (red). Filling fractures increases sweep efficiency in matrix pores and boosts recovery (blue). In the short term, fracturing significantly enhances production; however, gas storage in fractures can negatively affect long-term development.
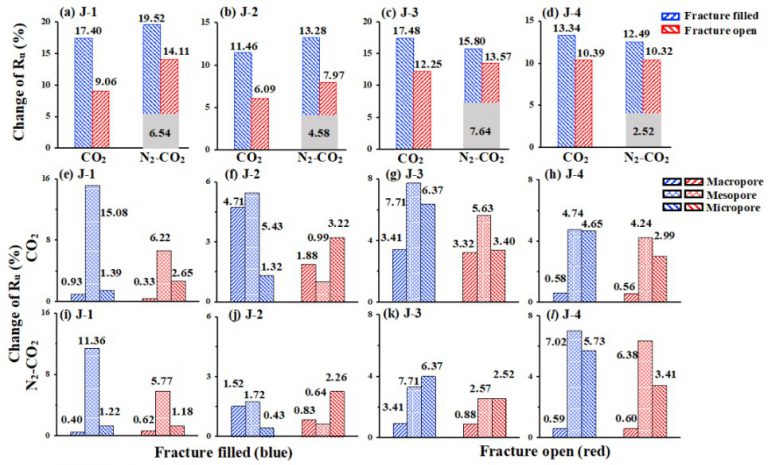
Figure 6. Incremental recovery under fracture filling and gas combination
References (Low-field NMR analysis):
1) Dong Xu, Shen Luyi*, Golsanami Naser, Liu Xuefeng, Sun Yuli, Wang Fei, Shi Ying, Sun Jianmeng. How N₂ injection improves the hydrocarbon recovery of CO₂HnP: An NMR study on the fluid displacement mechanisms. Fuel. 2020a. 278:118286.
2) Dong Xu, Shen Luyi*, Liu Xuefeng, Zhang Pengyun, Sun Yuli, Yan Weichao, Sun Jianmeng. NMR characterization of a tight sand’s pore structures and fluid mobility: An experimental investigation for CO₂ EOR potential. Marine and Petroleum Geology. 2020b.118:104460.
3) Liu Xuefeng, Dong Xu*, Golsanami Naser, Liu Bo, Shen Luyi W., Shi Ying, Guo Zongguang. NMR characterization of fluid mobility in tight sand: Analysis on the pore capillaries with the nine-grid model. Journal of Natural Gas Science and Engineering. 2021. 94.
 Scan QR Code
 Scan QR Code
Phone: 400-060-3233
After-sales: 400-060-3233


Back to Top