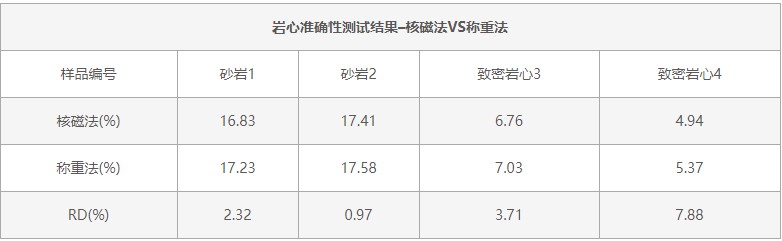
Case 1: Core Porosity Accuracy Test
Table 1. Core Porosity Accuracy Test
Case 2: Comparison of Pore Structure Distribution (Shale vs. Sandstone)

Figure 1. Comparison of T2 Distributions in Conventional Core and Shale
The T2 relaxation time distributions of shale and sandstone differ significantly. Shale-specific low-field NMR instruments are capable of detecting nanoscale pore signals.
Case 3: Comparison of Shale T2 Distributions under Different TE Values

Figure 2. Comparison of Shale T2 Distributions at Different TE Values
Instrument Used:
MicroMR12-025V Shale NMR Analyzer
 Scan QR Code
 Scan QR Code
Phone: 400-060-3233
After-sales: 400-060-3233


Back to Top