
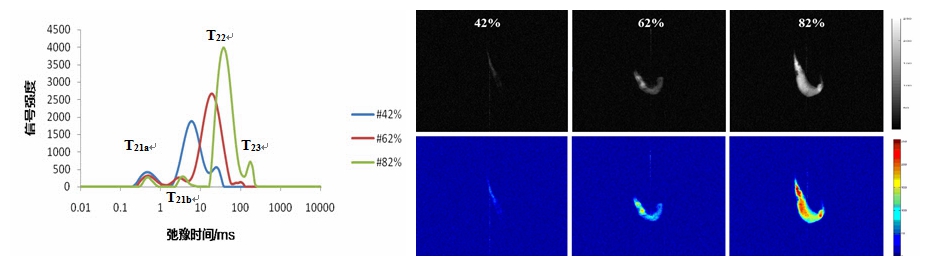
Figure 1. T2 Relaxation Profiles and Proton Density-Weighted Images of Shrimp Samples with Varying Moisture Content
Significant differences were observed in weakly bound water (T21b), immobile water (T22), and free water (T23) across shrimp samples with different moisture levels. As moisture increased, the mobility and content of immobile and free water also increased, resulting in brighter imaging signals.
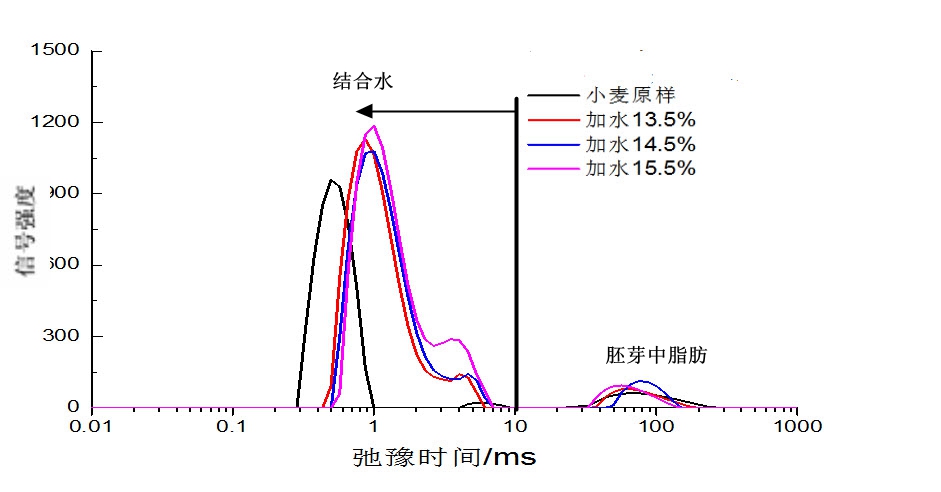
Figure 2-1. T2 Relaxation Profiles of Wheat After 24 Hours of Conditioning with Different Water Additions

Figure 2-2. NMR Imaging of Wheat Conditioned for 24 Hours at Varying Water Addition Levels
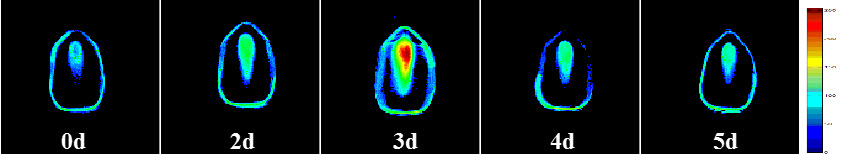
Figure 3. Visualization of Moisture Distribution During Corn Soaking
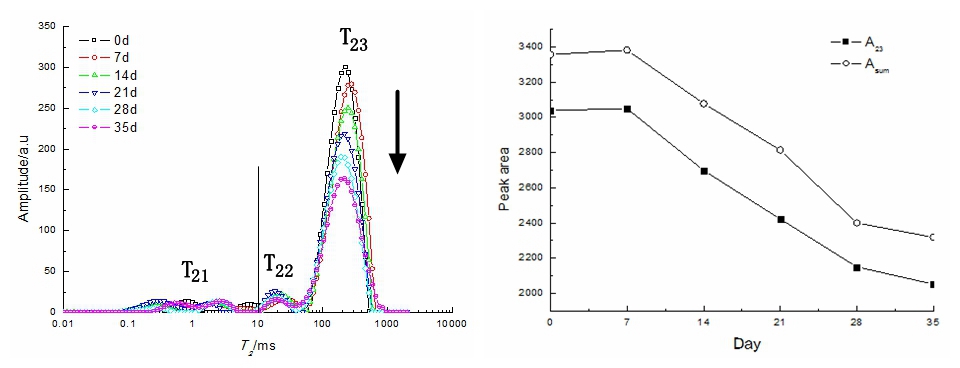
Figure 4.1: T2 Relaxation Profiles During Blueberry Storage at 4°C
Figure 4.2: Peak Area Changes During Blueberry Storage at 4°C
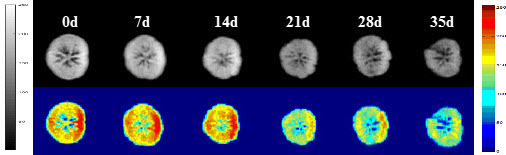
Figure 4.3: Proton Density-Weighted Imaging of Blueberries During Storage at 4°C
During cold storage at 4°C, blueberries gradually lost moisture. Minimal change was observed in the first 7 days, but significant water loss was noted after 14 days. The peak area of T23 (A23) and the total signal area decreased steadily, correlating with reduced image brightness and contrast.
Instrument Used: NMR Imaging Analyzer – Model NMI20-015V-I
 Scan QR Code
 Scan QR Code
Phone: 400-060-3233
After-sales: 400-060-3233


Back to Top