
Prepare soybean pods and beans at different growth stages. Use T1-weighted imaging to observe the spatial distribution of oil and identify the accumulation process of oil during soybean development.
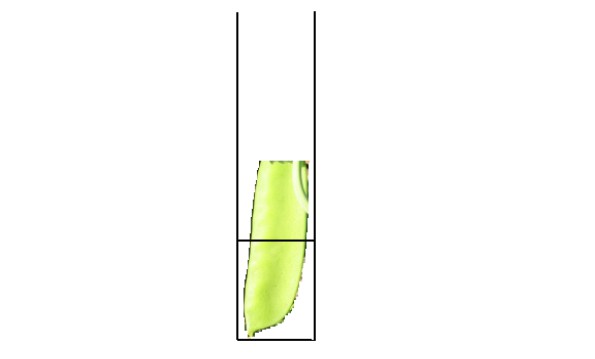
Place the soybean pod directly into the NMR tube. If the pod is too long, trim it to fit. The actual sample condition is shown below:
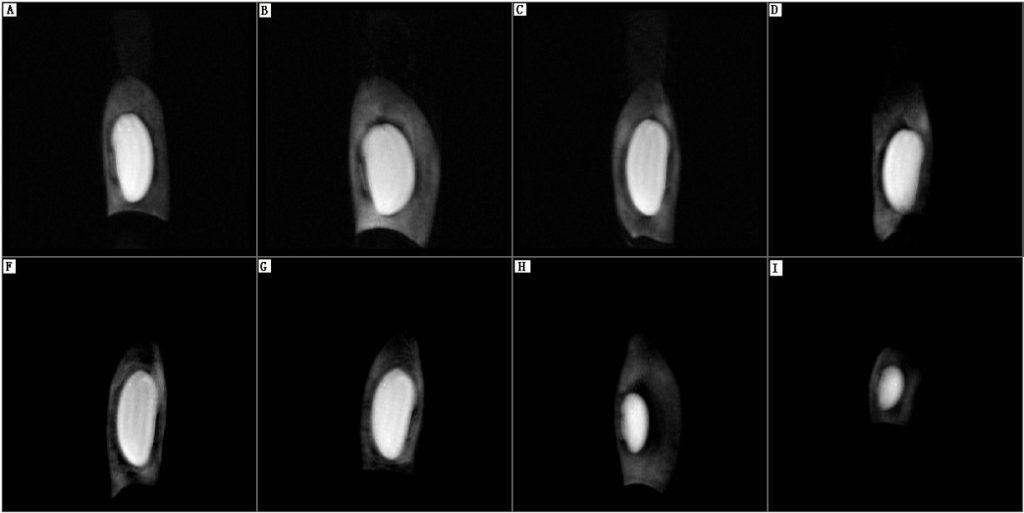
T1-weighted imaging builds upon proton density imaging by adding the influence of T1. Since the T1 of oil is shorter than that of water, and in T1-weighted images a shorter T1 corresponds to stronger signal and higher brightness, the oil signal is highlighted. In the image below, the pod shell and seed coat show low oil and high water content, appearing as weak signals (because water still contributes hydrogen protons, they remain visible). Inside the seed, brightness is uneven: under uniform proton density, higher brightness indicates shorter T1 values and therefore higher oil content. T1-weighted imaging provides a first look at the spatial distribution of oil.
 Scan QR Code
 Scan QR Code
Phone: 400-060-3233
After-sales: 400-060-3233


Back to Top