
Low-field nuclear magnetic resonance (LF-NMR) technology enables rapid and non-destructive measurement of water status and dynamics within plants. T1 and T2 relaxation times reflect the mobility of water molecules and serve as indicators of water dynamics in biological tissues. As the state and mobility of cell-associated water closely correlate with cellular health, NMR imaging represents a physiological map of tissues and can be used to study the hydrodynamics of cellular metabolism.
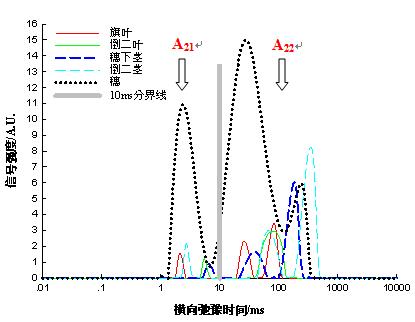
The NMR T2 relaxation spectrum provides T2 relaxation times along with their corresponding amplitudes. T2 relaxation times reflect the kinetic properties of water molecules and are influenced by factors such as microdomain size and structure, soluble sugar content, and membrane permeability. The amplitude corresponds to water content.
Study on the relationship between wheat NMR characteristics and relative water content
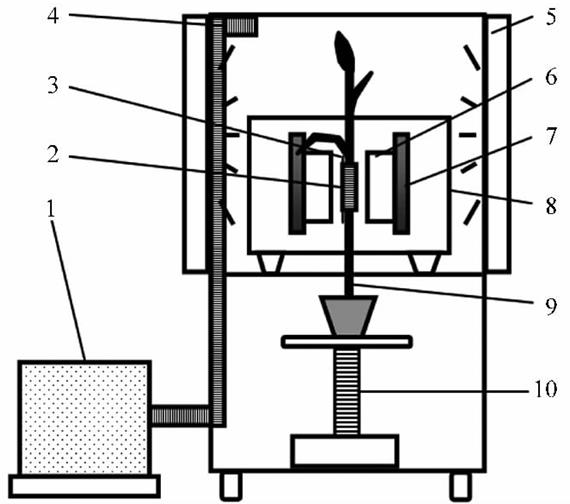
1. Temperature and humidity control chamber 2. RF probe 3. Reference tube 4. Air duct 5. Light box 6. Permanent magnet 7. Yoke 8. Magnet insulation box 9. Wheat plant 10. Lifting platform
The in vivo plant magnetic resonance imaging system provides an online platform for live plant testing. To maintain controlled climatic conditions during imaging, an artificial climate chamber was constructed outside the magnet enclosure. The frame is made of aluminum alloy, with acrylic panels on the sides and light boxes positioned on both sides of the chamber. The temperature and humidity control system is housed in a separate enclosure, containing an air conditioner, humidifier, and fan regulated by a temperature-humidity controller, and connected to the artificial climate chamber via air ducts.
The LF-NMR T2 relaxation spectrum amplitude is proportional to 1H content, and is used to analyse water, oil, and starch content. In theory, both water molecules and biological macromolecules generate 1H NMR signals, but their relaxation properties differ significantly. The T2 relaxation times of 1H in macromolecules, constrained by chemical groups, are much shorter than those of water. For example, 1H in lipids has a T2 relaxation time of around 200–400 ms, while pure water 1H relaxes in approximately 2 s. Additionally, water T2 relaxation is affected by interfacial effects: the central vacuole water in plant cells has a longer T2 than cytoplasmic or cell wall water. Due to the complex structure and composition of plant tissues, T2 spectra are typically multi-component. However, the distinction of T2 spectra varies across organs; for instance, oilseed NMR analysis requires samples with water content below 15%. LF-NMR T2 spectra effectively detect water content, water status, and water transport in roots, stems, leaves, seeds, and fruits.
References:
1. NMR Analysis of Wheat Leaf Senescence, Transactions of the Chinese Society of Agricultural Machinery;
2. Study on Water Distribution and Dynamics in Wheat Plants Based on NMR Technology, Transactions of the Chinese Society of Agricultural Engineering;
 Scan QR Code
 Scan QR Code
Phone: 400-060-3233
After-sales: 400-060-3233


Back to Top