
To obtain water distribution information of four dried strawberry samples using low-field nuclear magnetic resonance (LF-NMR) technology.
Four dried strawberry samples were provided by the client, labelled as: Control, 80℃-1.5h, 80℃-3h, and 80℃-4.5h.
NuMag low-field NMR imaging analyser, 0.5T magnet, 60mm coil diameter, magnet temperature set to 32.00℃.

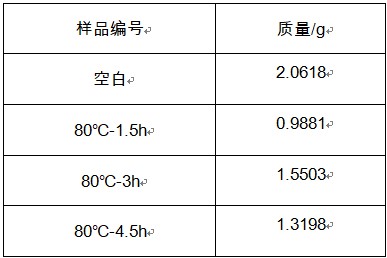
Samples were placed into the NMR coil for testing. The sample masses were recorded as shown in the table below.
T2 relaxation analysis was performed using the CPMG sequence; parameters as appropriate.
The CPMG sequence and SIRT inversion were used to generate the water distribution curves of the samples.
T2 Relaxation Analysis
The collected T2 decay curves were fitted and inverted using iterative optimisation to obtain T2 relaxation information, including relaxation times and corresponding signal components. The horizontal axis represents 200 T2 relaxation time components logarithmically distributed from 10^-2 ms to 10000 ms, while the vertical axis represents the corresponding signal components A2i (normalized by sample mass for quantitative analysis). Signal intensity is proportional to component content, and the integrated area A reflects the sample’s total signal.
T2 relaxation time reflects the chemical environment of hydrogen protons in the sample, which relates to the degree of proton restriction and freedom. The extent of proton binding is closely linked to the sample’s internal structure. Higher restriction or lower freedom results in shorter T2 times, shifting peaks to the left; lower restriction results in longer T2 times, shifting peaks to the right.
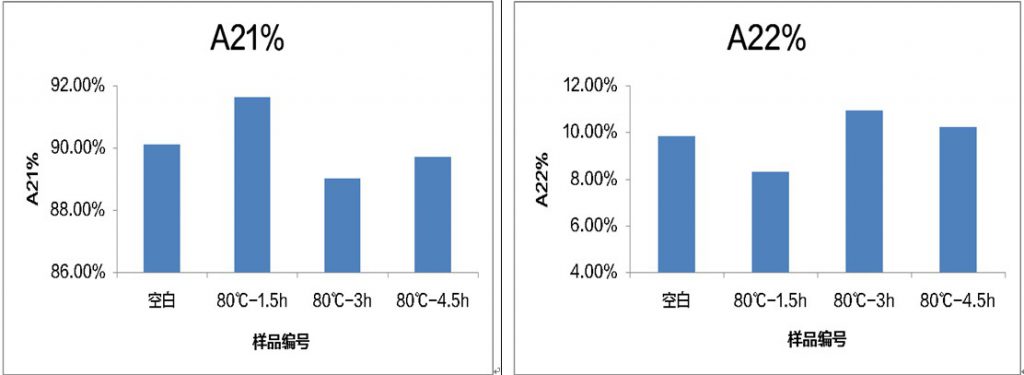
Three peaks represent protons with different relaxation times, and the peak area reflects the proton content of each component.
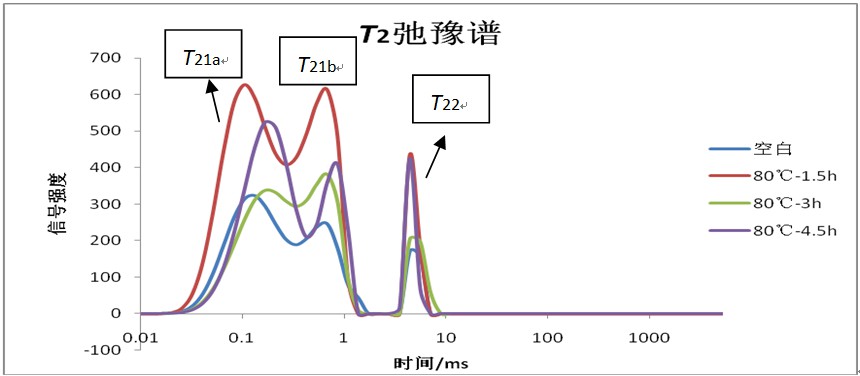
Observations from the data:
1. All samples exhibited three peaks, corresponding to bound water (T21a), semi-bound water (T21b), and less mobile water (T22).
2. The proportion of bound water in each sample is high, indicating very limited free water, reflected in short T2 relaxation times.
3. Differences in T2 times and peak proportions between samples are minor. The sample dried at 80℃ for 1.5h shows slightly lower bound water proportion than the other groups.
Water in all four samples primarily exists as bound water with very limited mobility, reflected in short T2 relaxation times. The sample dried at 80℃ for 1.5h has a slightly lower proportion of bound water compared with the other samples.
 Scan QR Code
 Scan QR Code
Phone: 400-060-3233
After-sales: 400-060-3233


Back to Top