

Introduction
During excavation of deep engineering rock masses, unloading effects generate numerous fractures, leading to instability and failure of surrounding rock. Grouting reinforcement is one of the most effective methods for treating fractured rock masses, significantly improving the mechanical properties and impermeability of surrounding rock. The filling degree of slurry in rock pores and fractures is an important parameter for evaluating grouting effectiveness.
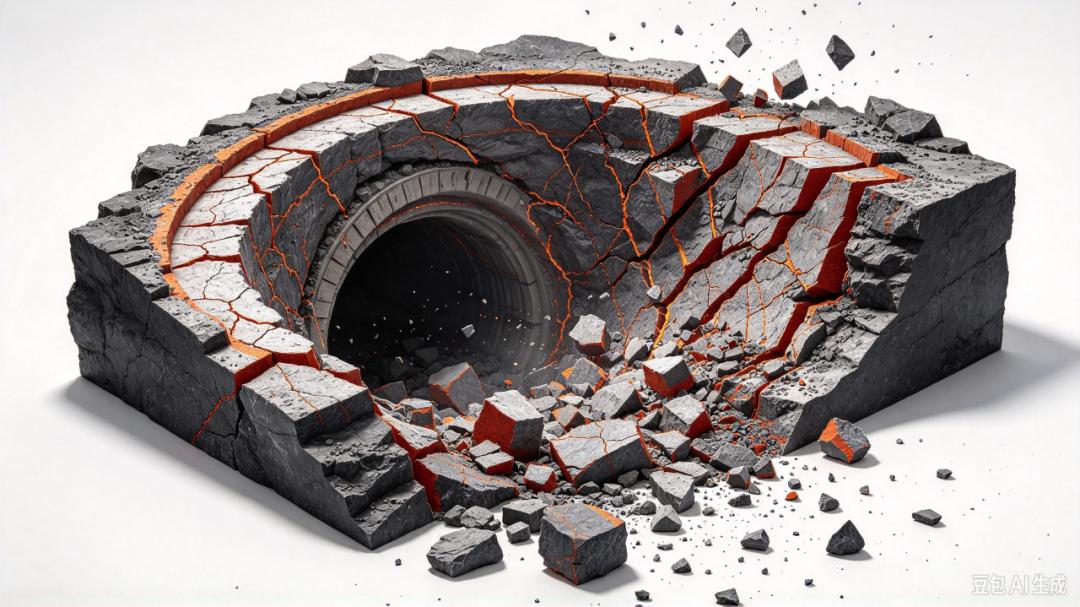
However, the seepage channels in rock masses consist of complex discontinuous structures (fractures and pores), making it difficult to accurately reflect the seepage characteristics of slurry in fractured rock masses or predict its diffusion range. Fracture characteristics, grouting parameters, and external geological conditions (such as fracture dip angle, injection pressure, and confining pressure) significantly affect the diffusion characteristics and filling degree of slurry in fractured rock masses.
Many studies have investigated the grouting mechanism in fractured rock masses through theoretical analysis and numerical methods. However, these methods are mainly based on geometric simplification and kinematic assumptions, making it difficult to truly demonstrate the seepage characteristics of slurry in real fractured rock structures. Experimental testing has become a powerful alternative for studying the diffusion characteristics of slurry in fractured rock masses, but due to methodological limitations, it remains difficult to reveal the diffusion process of slurry in real rock micropores under confining pressure. Low-field nuclear magnetic resonance (LF-NMR) , as a powerful non-destructive testing method, can accurately characterize microstructural evolution by monitoring the resonance relaxation process of hydrogen atoms. Its application in grouting tests enables real-time tracking of the slurry hydration process and observation of its diffusion characteristics in rock pores and fractures.
Existing studies have shortcomings in the diffusion process of chemical slurry: previous studies mostly analyzed the seepage process of slurry in fractured porous sandstone through subjective descriptions of NMR T₂ distributions, lacking quantitative analysis methods for slurry diffusion characteristics in complex fracture-pore media.
Research Case
Experimental Investigation on the Grouting Diffusion Characteristics and Relative Filling Degree of Chemical Slurry in Fractured Porous Sandstone [1]
Sample Information
Sandstone, cylindrical specimens with dimensions of Φ25 mm × H50 mm.
Fracture Configuration
To simulate different fracture states, three fractured porous sandstone specimens with different dip angles were prepared: θ = 0°, 10°, and 27°.
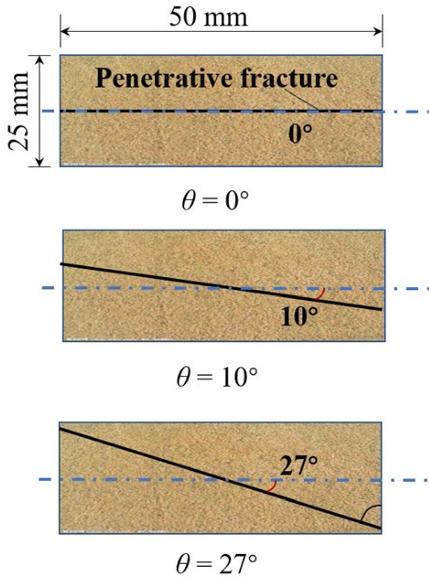
Schematic diagram of sample fractures
Experimental Equipment
Low-field NMR: MacroMR12-150H-I (Suzhou Niumag Analytical Instrument Corporation)
Experimental Protocol
01 #Experimental Design Logic#
To systematically investigate the effects of three variables—confining pressure, injection pressure, and fracture dip angle—on the diffusion characteristics of slurry in fractured porous sandstone, these three parameters were systematically varied, corresponding to different combinations of injection pressure (0.5, 1.0, 1.3 MPa), confining pressure (2, 5, 10, 20 MPa), and fracture dip angle (0°, 10°, 27°).
02 #Slurry Material Selection and Testing#
First, the initial setting time of chemical slurries with different mix ratios was measured by the inverted cup method at a constant temperature of 20°C. Based on equipment safety, slurry with mix ratio 7 was selected. Subsequently, the time-dependent rheological properties of the selected slurry were tested using a rotational viscometer. The results showed that the viscosity curve exhibited three stages: initial, slow growth, and rapid growth.
03 #Specimen and Confining Pressure Application#
The dried fractured porous rock sample was tightly connected to the core holder using heat-shrink tubing. After connecting the oil tubing, different confining pressures (2.0, 5.0, 10, and 20 MPa) were applied by injecting fluorinated oil. The initial NMR T₂ signal of the dried specimen was then measured.
04 #Grouting and Real-Time Monitoring#
After connecting the grouting pipeline, slurry was stably injected at different injection pressures (0.5, 1.0, and 1.3 MPa), and the NMR T₂ signal was measured every 15 seconds. The injection pressures of 0.5, 1.0, and 1.3 MPa were equivalent to injection rates of 3, 5, and 7 mL/min, respectively.
Experimental Analysis
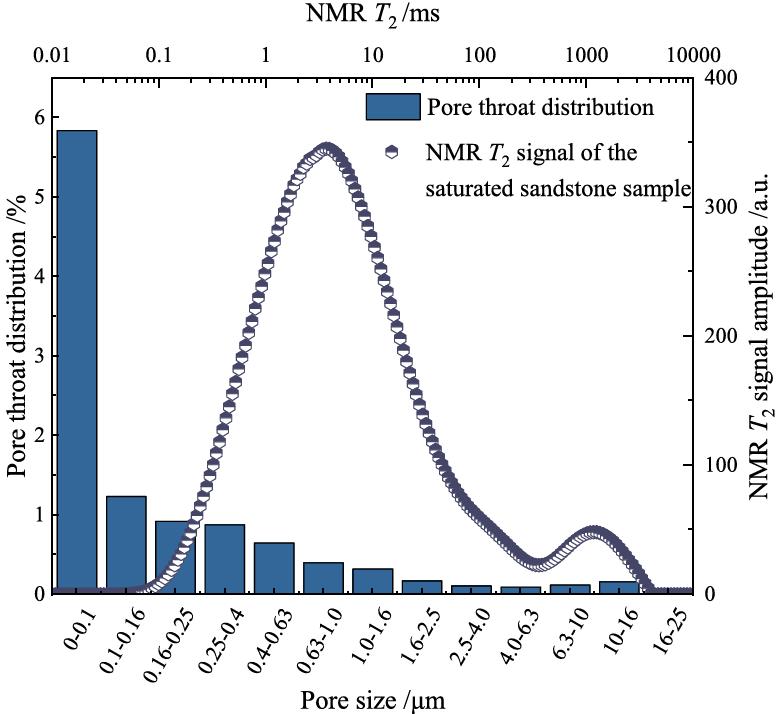
Pore Size Distribution of Sandstone by NMR Method
The pore distribution curve and NMR T₂ distribution curve of the sandstone used (the figure indicates that the pore size is mainly concentrated in the range of 0.01–0.16 μm, and the NMR T₂ signal exhibits a peak at approximately 1–10 ms, corresponding to the fluid relaxation behavior in the pores).
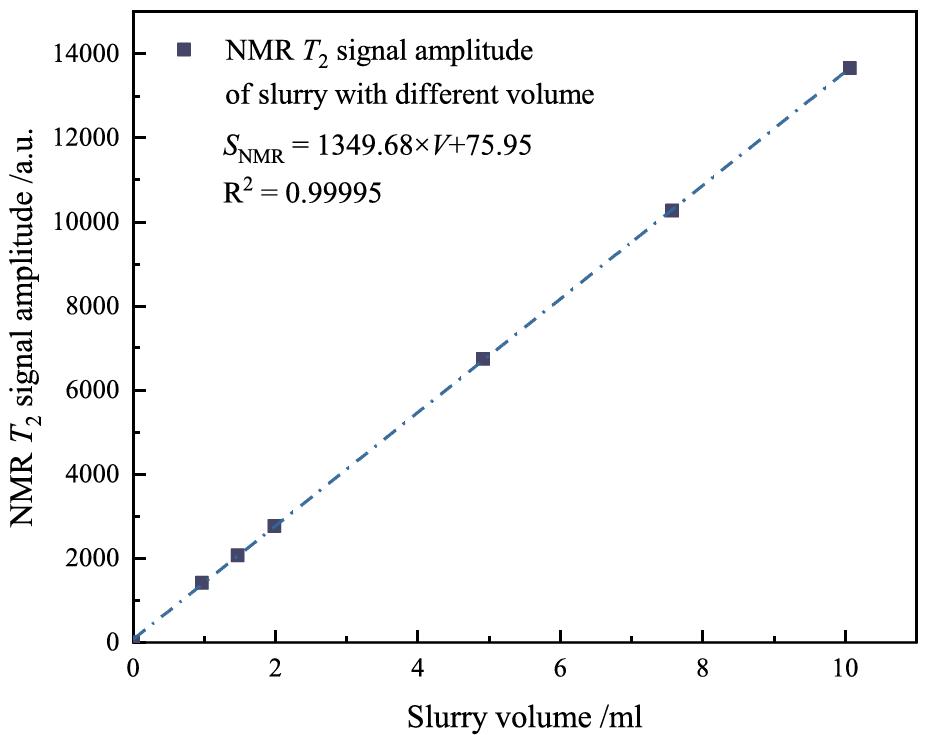
Relationship Curve Between NMR Signal and Grouting Content
This provides a key calibration relationship for quantitative conversion between NMR signal and slurry volume. After formal grouting tests, the real-time monitored NMR T₂ signal intensity can be converted into actual injected slurry volume. This provides a prerequisite for quantitatively analyzing the variation of injected slurry volume with time under different confining pressures, injection pressures, and fracture dip angles.
01 Experimental Results of the Time-Dependent Evolution of NMR T₂ Relaxation Distribution During Slurry Injection into Pores and Fractures Under Different Confining Pressures
Each subplot shows the NMR T₂ relaxation spectrum under the same condition, with the horizontal axis representing relaxation time T₂ (logarithmic scale) and the vertical axis representing NMR signal amplitude. The figure includes curves at four time points: t = 0 s, 30 s, 60 s, and 90 s, used to characterize the dynamic evolution of fluid distribution in pores and fractures during slurry injection. This group of tests was completed under the conditions of injection pressure Pd = 1.3 MPa and fracture dip angle θ = 0°.
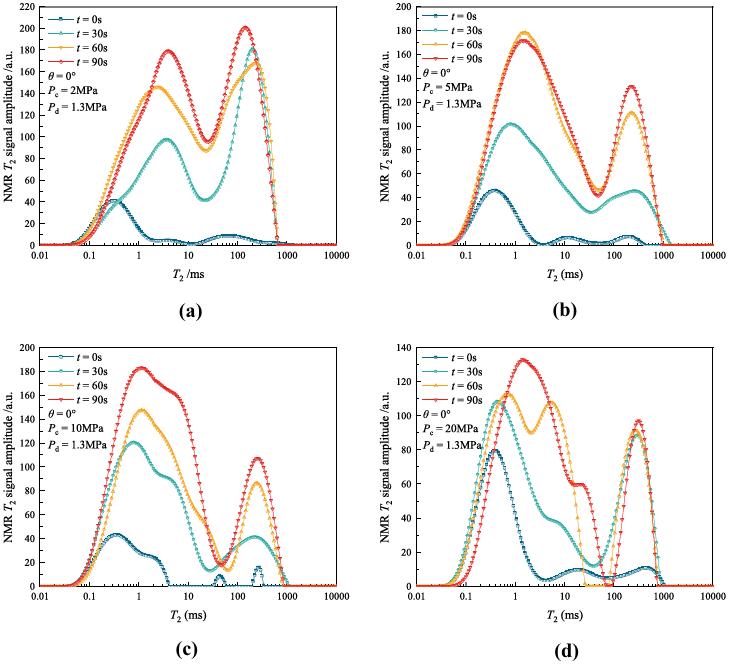
Grouting relaxation distribution under different confining pressures
The influence of confining pressure on slurry diffusion mode can be understood from the differences in the evolution characteristics of NMR T₂ curves under different confining pressures. In the initial state, the NMR T₂ relaxation distribution of the dried fractured porous sandstone specimen generally exhibited a three-peak distribution, where the three peaks (P₁, P₂, and P₃) respectively reflect the slurry injection volume in micropores, macropores, and fractures in the specimen. When the grouting time increased from t = 0 s to 30 s, the first peak (P₁) began to merge with the second peak (P₂) to form a new first peak (P₁₊₂). Both the newly formed first peak (P₁₊₂) and the second peak (P₃) increased significantly, indicating that an injection pressure of 1.3 MPa can overcome the influence of confining pressure and inject slurry simultaneously into rock pores and fractures. It should be noted that as confining pressure increased, the injection volume was significantly suppressed, especially the slurry injection volume in fractures. When confining pressure increased from 2.0 MPa to 20 MPa, both the peak value and area of the second peak (P₃) decreased substantially. In addition, under the condition of Pc ≥ 10 MPa, the peak area of the new peak (P₁₊₂) was also significantly smaller than under the other two confining pressure conditions.
02 Experimental Results of the Time-Dependent Evolution of NMR T₂ Relaxation Distribution During Slurry Injection into Pores and Fractures Under Different Injection Pressures
Each subplot shows the NMR T₂ relaxation spectrum under the same condition, with the horizontal axis representing relaxation time T₂ (logarithmic scale) and the vertical axis representing NMR signal amplitude. The figure includes curves at four time points: t = 0 s, 30 s, 60 s, and 90 s, used to characterize the dynamic evolution of fluid distribution in pores and fractures during slurry injection. This group of tests was completed under the conditions of confining pressure Pc = 10 MPa and fracture dip angle θ = 0°.
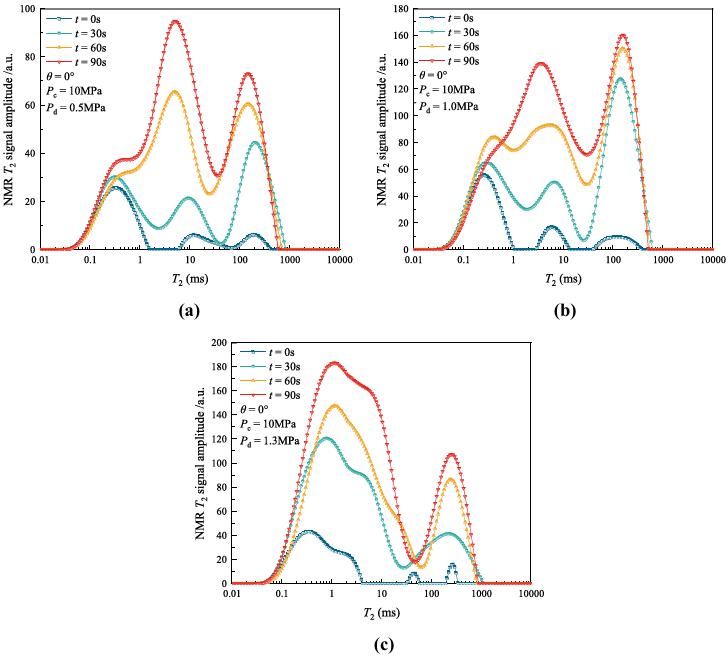
Grouting relaxation distribution under different injection pressures
The influence of injection pressure on slurry diffusion mode can be understood from the differences in the evolution characteristics of NMR T₂ curves under different injection pressures. Under a relatively low injection pressure (Pd = 0.5 MPa), when the grouting time reached 30 s, the NMR T₂ curve still exhibited a three-peak distribution, in which the area of the third peak (P₃) increased significantly, indicating that slurry diffusion mainly occurred in fractures at this stage. When the grouting time reached 60 s, the first peak (P₁) began to merge with the second peak (P₂) to form a new peak (P₁₊₂), and both the new peak and the second peak increased significantly, indicating that slurry could diffuse into both pores and fractures simultaneously. When the grouting time reached 90 s, the increase in the new peak was significantly greater than that of the second peak, indicating that an injection pressure of 0.5 MPa under a confining pressure of 10 MPa still could not effectively drive slurry into fractures, and the increase in NMR signal mainly originated from slurry diffusion in pores.
03 Experimental Results of the Time-Dependent Evolution of NMR T₂ Relaxation Distribution During Slurry Injection into Pores and Fractures Under Different Fracture Dip Angles
Each subplot shows the NMR T₂ relaxation spectrum under the same condition, with the horizontal axis representing relaxation time T₂ (logarithmic scale) and the vertical axis representing NMR signal amplitude. The figure includes curves at four time points: t = 0 s, 30 s, 60 s, and 90 s, used to characterize the dynamic evolution of fluid distribution in pores and fractures during slurry injection. This group of tests was completed under the conditions of confining pressure Pc = 2 MPa and injection pressure Pd = 1.3 MPa.
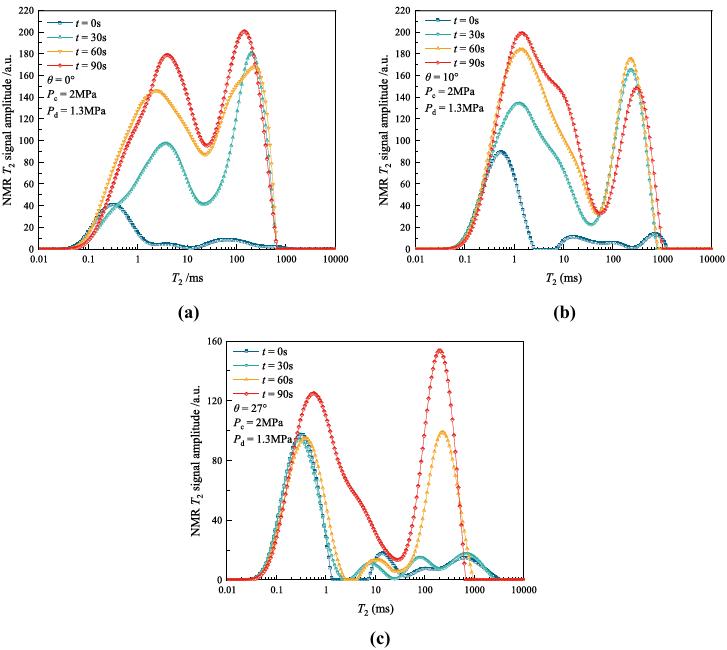
Grouting relaxation distribution under different grouting angles
The influence of fracture dip angle on slurry diffusion mode can be understood from the differences in the evolution characteristics of NMR T₂ curves under different dip angles. For the specimen with θ = 0° (fracture direction consistent with the injection pressure direction), when the grouting time reached t = 30 s, the first peak (P₁) began to merge with the second peak (P₂) to form a new first peak (P₁₊₂), and both the newly formed first peak and the second peak (P₃) increased significantly, indicating that when the fracture dip angle was θ = 0°, an injection pressure of 1.3 MPa could inject slurry simultaneously into macropores and fractures. When the grouting time reached t = 60 s, the areas of the new peak (P₁₊₂) and the second peak (P₃) increased significantly, but the peak value of the second peak (P₃) slightly decreased. This may be because the previously injected slurry was continuously absorbed by pores on both sides of the fracture surface. When the grouting time reached t = 90 s, the areas of both peaks continued to increase, but at a lower growth rate, because the grouting process was approaching a yield state, and the slurry diffusion rate decreased. When the fracture dip angle was θ = 10°, the evolution process of the NMR T₂ signal of the slurry was similar to that at θ = 0°. Under the conditions of Pc = 2.0 MPa and Pd = 1.3 MPa, slurry could be injected simultaneously into pores and fractures when the grouting time reached t = 30 s.
Summary
1 Confining pressure affects the diffusion path and efficiency of slurry by compressing rock fractures and pores
Due to the presence of multi-scale pores in rock specimens, the specimen undergoes compressive deformation under confining pressure during grouting, resulting in reduced pore volume and fracture aperture, making it difficult to form dominant seepage channels. This directly affects the diffusion characteristics of slurry in rock specimens, manifested as a decrease in the permeability of slurry in fractured porous sandstone with increasing confining pressure.
2 Injection pressure directly determines the diffusion mode of slurry in fractured porous sandstone
Under lower injection pressure, slurry is difficult to directly enter micropores, and the diffusion mode is fracture → macropore → micropore. Under higher injection pressure, the injection pressure can drive slurry directly into rock pores, and the diffusion mode is micropore → fracture → macropore.
3 Fracture dip angle affects the diffusion process by changing the initial seepage direction of slurry
When the fracture dip angle increases, energy loss reduces the lateral diffusion capacity of the injection pressure, making it difficult for slurry to enter pores and fractures. The overall injected slurry volume decreases accordingly, and the permeability of slurry in fractured porous sandstone decreases linearly with increasing fracture dip angle. Specifically, when the fracture dip angles are θ = 0° and 10°, the seepage mode of slurry in fractured porous sandstone is fracture → macropore → micropore; when the fracture dip angle is θ = 27°, the seepage mode changes to micropore → fracture → exchange between fractures and pores.
Reference
[1] Experimental Investigation on the Grouting Diffusion Characteristics and Relative Filling Degree of Chemical Slurry in Fractured Porous Sandstone.
 Scan QR Code
 Scan QR Code
 Phone Support
Phone: 400-060-3233
After-sales: 400-060-3233
 WeChat Support

 Official Account

Back to Top