
Research Background
Shale gas reservoirs exhibit a variety of pore types, which can be classified as organic and inorganic based on their origin. Organic pores are linked to the thermal evolution of organic matter and hydrocarbon generation, while inorganic pores result from mineral deposition and diagenetic processes.
Currently, the most effective method to identify and evaluate organic and inorganic pores in shale is Focused Ion Beam-Scanning Electron Microscopy (FIB-SEM). While this technique allows direct observation of microscopic pore components, its field of view is limited. Other methods for measuring pore size distribution include mercury intrusion, liquid nitrogen, and CO₂ adsorption. These are indirect techniques and cannot differentiate between organic and inorganic pores.
Low-field nuclear magnetic resonance (NMR) is a powerful tool for determining porosity and pore size. By exploiting the wettability differences between organic and inorganic pores, hydrogen signals can be measured under water- and oil-saturated conditions to establish a quantitative relationship between relaxation time and pore size. This approach enables the identification and characterisation of organic and inorganic pores using NMR technology.
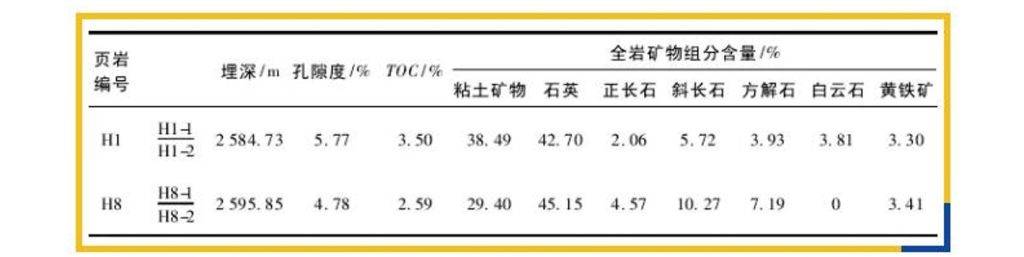
Samples were collected from the Longmaxi Formation shale of the Silurian system in the Fuling region. The physical properties, total organic carbon (TOC) content, and mineral composition of the samples are listed in the table below.
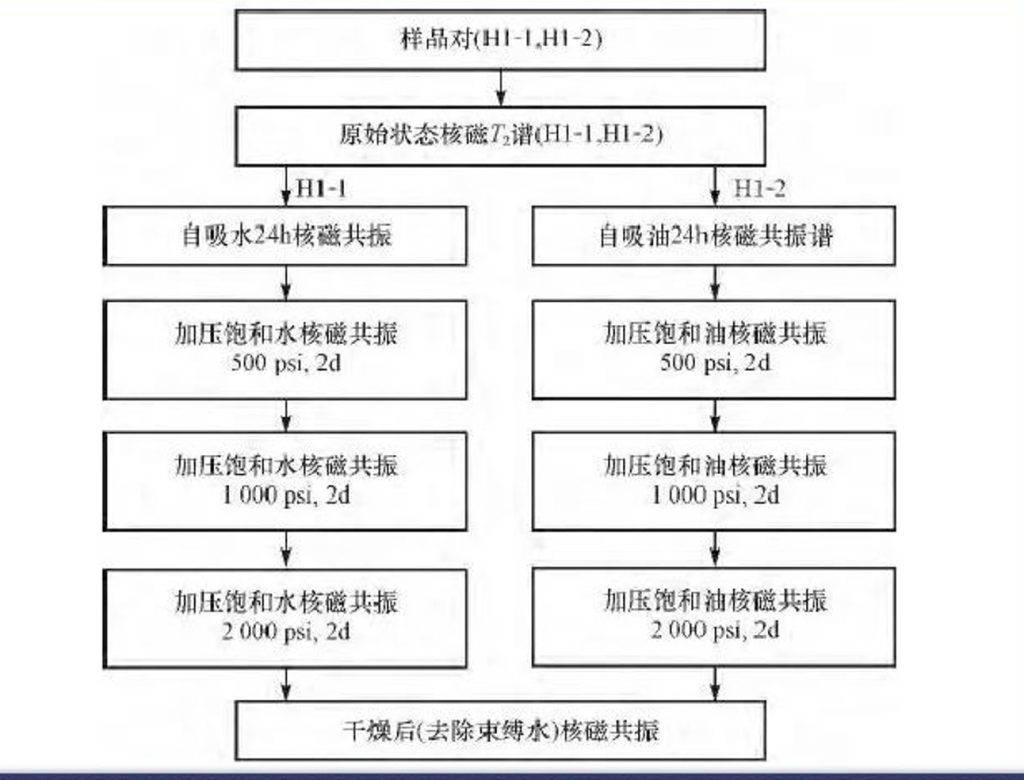
To identify the T2 spectral peaks corresponding to organic and inorganic pores, each core from the same depth was divided into two parts. T2 measurements were then performed under saltwater- and oil-saturated (n-dodecane) conditions, as illustrated in the figure below.
1. T2 Spectra under Saltwater- and Oil-Saturated Conditions
During the experiments, cores were saturated with water or oil either by spontaneous imbibition or under pressure. The results showed distinct differences in the T2 spectra of oil-wet and water-wet pores. For cores saturated with oil via spontaneous imbibition, oil-wet pores displayed T2 peaks around 0.2 ms and 8 ms, with the former significantly larger. This indicates two types of oil-wet pores, with smaller pores being dominant. Pressurised oil saturation showed minimal differences compared to spontaneous imbibition, indicating strong oil-wettability and rapid saturation. These oil-wet pores correspond to organic pores.
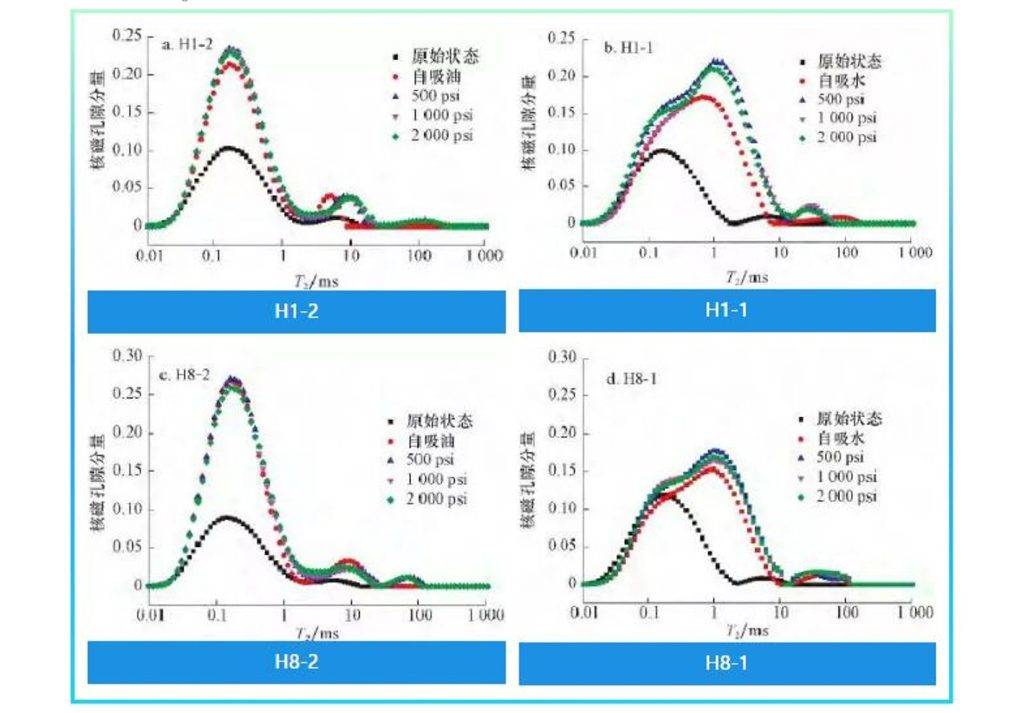
For water-saturated cores, water-wet pores mainly appeared around 1 ms. NMR signals under pressure were stronger than those in spontaneous imbibition, indicating that pressurisation allowed water to penetrate smaller pores. Water-wet pores correspond to inorganic pores.
2. Quantitative Relationship between T2 Time and Pore Size in Shale
The T2 spectrum is used to determine pore size distribution based on the assumption of a linear relationship between T2 relaxation time and pore radius: r = k·T2.
By comparing T2 spectra with pore size distributions obtained from combined mercury intrusion and liquid nitrogen adsorption, the proportionality constant k was determined. Overlaying oil-wet and water-wet pore spectra provides a comprehensive view of shale pore structure. Mercury intrusion is suitable for larger pores, while liquid nitrogen adsorption effectively measures mesopores (2–50 nm). The comparison shows consistency between the T2 spectral envelope and pore size distributions from mercury and nitrogen adsorption, yielding the relationship: rb = 52·T2.
High-resolution FIB-SEM observations were conducted on H8 shale cores from the Longmaxi Formation in Fuling to identify pore types. The image below illustrates intergranular pores of fine-grained minerals (inorganic pores), organic pores, and microfractures. These pores have different size ranges: organic pores are nanometre-scale, intergranular pores of fine-grained minerals range from micro- to nanometres, and microfractures are larger, at the micrometre scale.

This distribution is consistent with the three-peak T2 spectra observed in NMR. The NMR-derived pore size distribution, converted using the established formula, matches the distribution determined from SEM images, further confirming that NMR can reliably identify and evaluate organic and inorganic pores in shale.
Comparison of H8 Core T2 Spectra with Mercury/Nitrogen Adsorption Measurements
1. Organic and inorganic pores exhibit distinct T2 spectra under oil- and saltwater-saturated conditions. Experiments on Longmaxi Formation shale cores from Fuling show that organic pores are strongly oil-wet, with T2 peaks around 0.2 ms, while inorganic pores are water-wet, peaking around 1 ms.
2. NMR-based pore characterisation aligns closely with FIB-SEM results. NMR offers two major advantages: it is non-destructive, allowing repeated measurements, and it can measure full-diameter cores, reflecting true subsurface conditions at a macro scale.
References:
Li Jun, Jin Wujun, Wang Liang, Wu Qingzhao, Lu Jing, Hao Shibo. Determining Organic and Inorganic Pore Size Distributions Using NMR: A Case Study of the Silurian Longmaxi Formation Shale Gas Reservoir in Fuling, Sichuan Basin [J]. Petroleum and Natural Gas Geology, 2016, 37(01):129-134.
 Scan QR Code
 Scan QR Code
Phone: 400-060-3233
After-sales: 400-060-3233


Back to Top