
Hello everyone! Today, we’ve carefully selected a newly published article (Feb 2020, Journal of Tianjin University) that applies nuclear magnetic resonance (NMR) technology to investigate the distribution patterns of water and diesel within the pores of silty soil contaminated by diesel. While the experimental setup is relatively straightforward, the findings are quite interesting—we hope you find it helpful!
Core Concept: Diesel is introduced as the contaminant. Water and diesel are added to the silt samples in specific proportions. To distinguish water and oil in the T2 spectrum, a low concentration of Mn2+ is added to the water to shorten its relaxation time. The study investigates how different sequences of adding water and diesel affect their respective distribution within the pore structure.
In single-phase systems, diesel tends to preferentially occupy larger pores compared to water. In water–diesel dual-phase systems, as oil content increases, discontinuous pore oil transforms into a continuous phase, leading to the enrichment of oil in larger pores. When diesel enters the pore space first, being a non-wetting phase, it preferentially occupies larger pores and throats, forcing subsequently introduced water to occupy the larger pores as well.
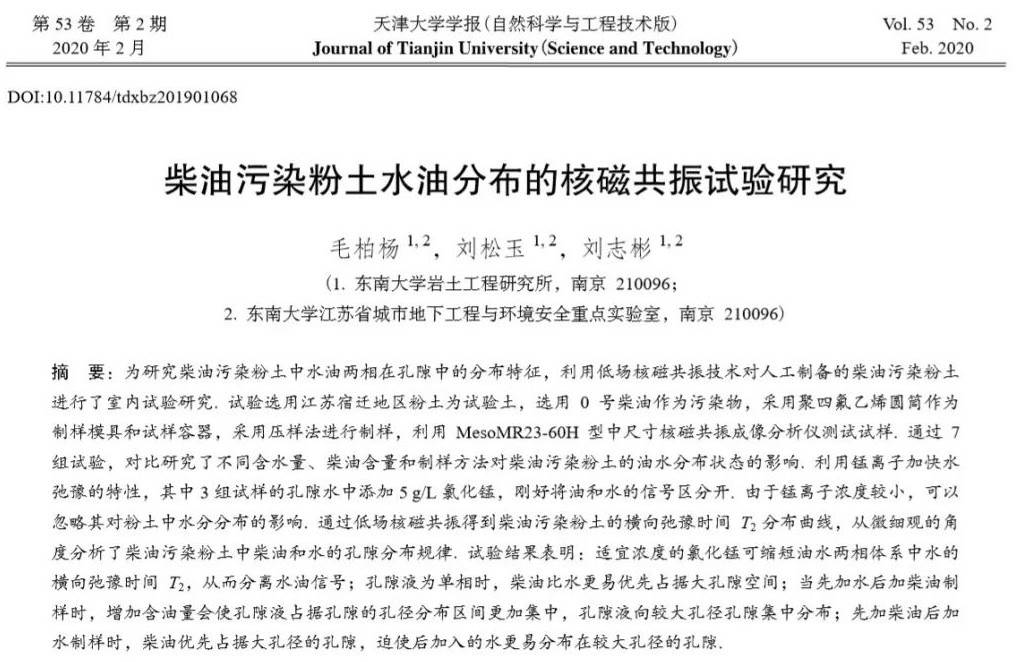
1. Experimental Design and Procedure: 0# diesel was used as the pollutant. Soil and water were mixed in a 1:1 ratio to prepare the silty matrix. Water and diesel were added in various proportions to the silty samples. After each addition, samples were sealed with cling film and cured in a humidity-controlled chamber for 48 hours before further operations. The samples were placed in polytetrafluoroethylene (PTFE) cylindrical molds with internal dimensions of 50mm × 55mm (height × diameter). NMR analysis was performed using the MesoMR23-60H-I nuclear magnetic resonance imaging system produced by Suzhou Niumag Corporation.
▲ Figure 1. Sample configuration parameters
2. Results Analysis
01. Diesel preferentially occupies larger pores in single-phase systems
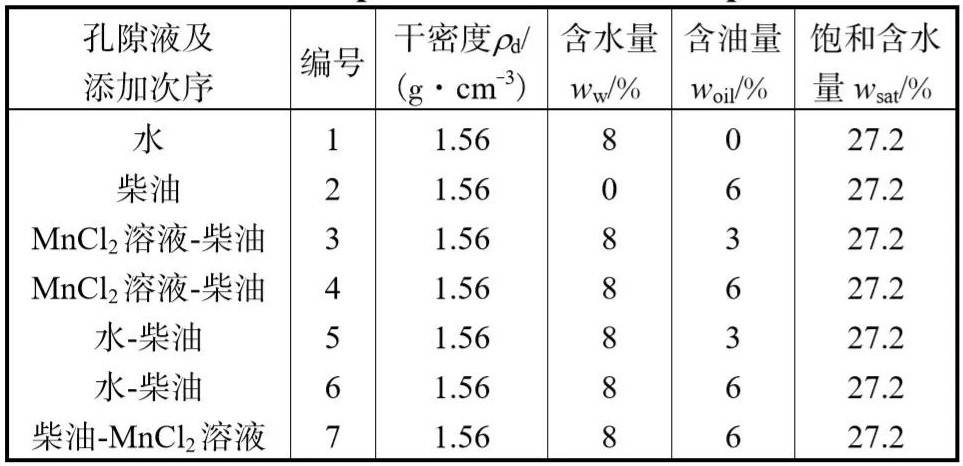
As shown in Figure 2, groups 1 and 2 represent samples containing only water and diesel, respectively. The T2 distribution for Group 1 is primarily within 0.1–10.0 ms, while for Group 2 it extends to 0.1–100.0 ms, with fewer signals near 0.1 ms. T2 relaxation time is proportional to pore size, meaning 0.1–10.0 ms corresponds to small pores and 10.0–100.0 ms to larger ones. Therefore, we conclude that diesel more readily occupies larger pores than water in single-phase systems.
▲ Figure 2. T2 relaxation curves of Groups 1 and 2
Due to the significant overlap between the T2 curves of distilled water and diesel samples, Mn2+ ions were added to shorten the water’s relaxation time, allowing better separation of water and diesel signals. Thus, it became necessary to evaluate how Mn2+ affects the T2 relaxation curves in the presence of both water and diesel.
Adding MnCl2 to the mixture shortens water’s relaxation time without affecting diesel.
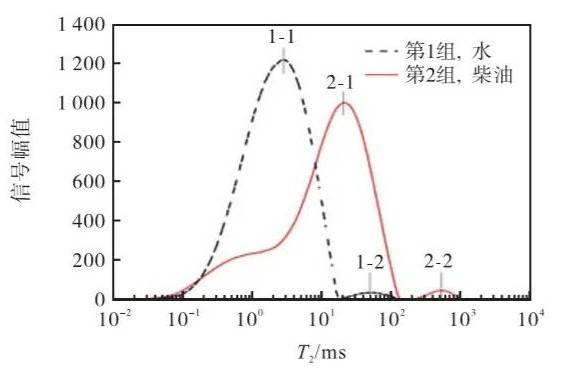
▲ Figure 3. T2 relaxation curves for Samples 3–6
Similar to Figure 2, the T2 curves of Groups 3–6 all exhibit a dual-peak profile. Due to the presence of 5 g/L Mn2+, oil and water signals in Samples 3 and 4 were successfully separated, as shown by their clearly distinct dual peaks in the T2 spectra. A quantitative analysis of the peaks for these four samples follows.
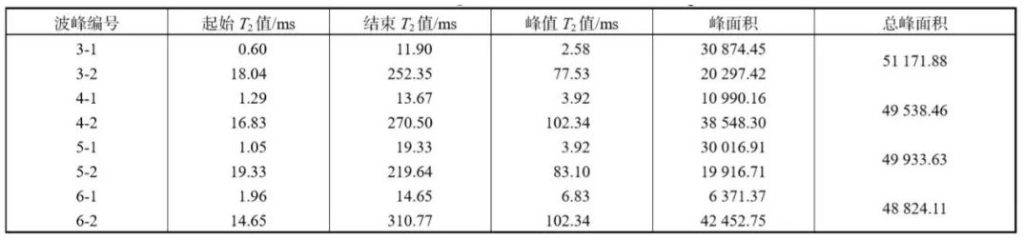
▲ Figure 4. Peak information for T2 curves of Samples 3–6
Compared with Sample 3, Sample 4 exhibits a narrower T2 interval, and the left endpoint of the interval shifts to the right. A similar trend is observed between Samples 6 and 5. Additionally, the second peak area of Samples 4 and 6 accounts for a significantly larger proportion of the total peak area than in Samples 3 and 5.
These observations suggest that, in both MnCl2 solution–diesel and water–diesel systems, when the water content remains constant, an increase in diesel content causes the fluid’s pore size distribution to shift toward larger pores. This implies that diesel becomes increasingly concentrated in larger pores. The key reason for this redistribution is a transition in the diesel phase morphology, as higher oil content causes a shift from disconnected to more continuous distributions within the pores.
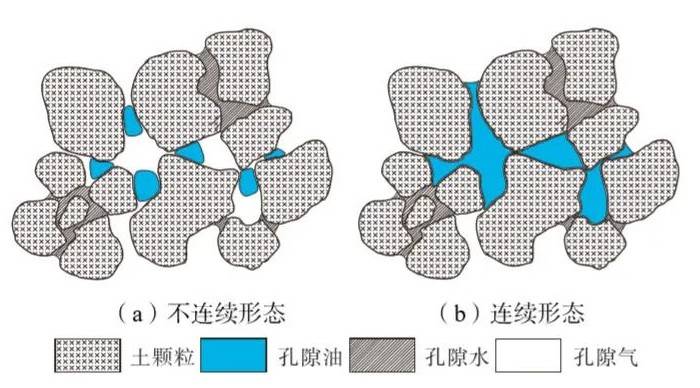
▲ Figure 5. Distribution of non-aqueous phase liquids (NAPLs) in porous media
The mechanism can be explained as follows: In porous media, non-aqueous phase liquids (NAPLs) may exist either in discontinuous or continuous forms, as shown in Figure 5. When NAPL saturation exceeds the residual saturation threshold, it tends to form a more continuous network, although it does not fill all large pores. In silty soil, diesel—acting as a non-wetting phase—can cause small pore clusters (as seen in Figure 5(a)) to coalesce into larger accumulations (as in Figure 5(b)) as diesel content increases, ultimately redistributing into larger pore spaces.
When diesel enters the pores first, it preferentially occupies larger pores and pore throats.
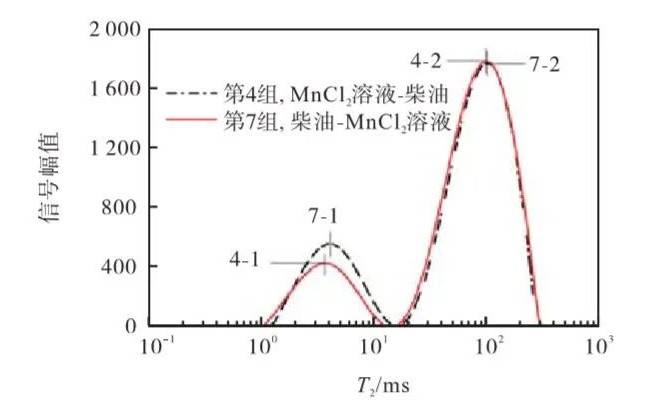
▲ Figure 6. T2 spectrum curves for Samples 4 and 7
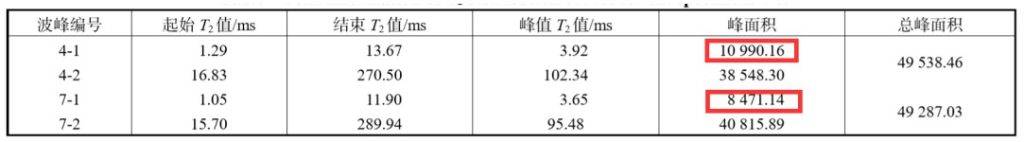
▲ Figure 7. T2 spectrum data for Samples 4 and 7
The total peak areas of Samples 4 and 7 are nearly identical, confirming the consistency and reliability of the sample preparation. Upon further analysis, it is observed that Sample 7 exhibits a slightly smaller first peak area and a slightly larger second peak area compared to Sample 4.
Since the second peak primarily represents diesel NMR signals and the first peak corresponds to the MnCl2 solution, the results indicate that when diesel is introduced as the first phase, it preferentially enters the larger pores. Consequently, the subsequently added water also tends to occupy larger pore spaces. This confirms that the fluid introduction sequence has a significant impact on the pore-scale distribution of water and diesel within silty soil matrices.
Editor’s Note
This study effectively utilises the proportional relationship between T2 relaxation time and pore size to investigate the distribution of water and diesel within the pore structure of silty soil under two-phase infiltration. This is a noteworthy approach for similar porous media analysis.
Moreover, the introduction of MnCl2 successfully shortens the relaxation time of water without affecting the NMR signal of diesel. This separation technique allows for clear signal differentiation and enhances the accuracy of analysis. The methodology is both clever and scientifically sound.
 Scan QR Code
 Scan QR Code
Phone: 400-060-3233
After-sales: 400-060-3233


Back to Top