
Abstract:
Pore water distribution (PWD) in soil provides critical information for revealing soil shear strength, permeability characteristics, and water retention capacity. The pore water distribution characteristics of soil are influenced by specimen preparation conditions (such as variations in initial water content or compaction degree) as well as wetting-drying processes. This paper employed Nuclear Magnetic Resonance (NMR) technology to investigate the aforementioned factors. Through mathematical transformation, the NMR T2 spectrum was converted into a pore water distribution curve, enabling more accurate quantitative characterization of pore water content variations across different pore size ranges. Results indicate that pore water in silty clay can be categorized into three types: adsorbed water, intra-aggregate pore water, and inter-aggregate pore water, corresponding to pore size ranges of <0.05μm, 0.05–1.0μm, and >1.0μm, respectively. The effects of compaction degree and initial water content on soil pore water distribution exhibited distinct differences. For unsaturated compacted specimens, the pore water distribution was largely unaffected by changes in compaction degree, whereas an increase in initial water content promoted the formation of clay aggregates, thereby increasing the maximum water-holding pore radius and enhancing intra-aggregate pore water content. For saturated compacted specimens, as the compaction degree decreased, both inter-aggregate and intra-aggregate pore water contents increased; simultaneously, with increasing initial water content, the pore water distribution pattern gradually transformed from unimodal to bimodal. During soil drying, inter-aggregate pore water was rapidly expelled, the dominant intra-aggregate pore water content first increased and then decreased, while strongly adsorbed water content remained constant throughout. Based on the Young–Laplace theory, a relationship can be established between the cumulative pore water distribution curve and the soil-water characteristic curve (SWCC). Utilizing the envelope of cumulative pore water distribution curves during soil drying allows for relatively accurate prediction of the SWCC.
Research Background:
Pore water distribution in soil refers to the quantitative relationship between pore diameter and its corresponding pore water content. It governs the hydraulic and mechanical behavior of soil, such as shear strength, permeability, compressibility, and water retention capacity. Currently, various methods exist for measuring soil pore structure, including Mercury Intrusion Porosimetry (MIP), Scanning Electron Microscopy (SEM), and X-ray computed tomography. However, technical means capable of directly measuring soil pore water distribution remain very limited. For instance, in unsaturated soil specimens, not all pores are filled with water, whereas MIP technology measures all pores within the soil (including water-filled pores, unsaturated pores, and dry pores), making it difficult to reflect the true pore water distribution characteristics. Compared to the shortcomings of traditional experimental methods in characterizing soil pore water distribution, Nuclear Magnetic Resonance (NMR) technology offers an excellent solution. Given that NMR technology can capture pore water stored in pores of different sizes, it is highly suitable for revealing the microscopic mechanisms of pore water migration and redistribution in soil. In unsaturated soil mechanics research, some scholars have utilized NMR technology to test soil T2 curves, but their discussions were primarily confined to changes in macroscopic water content, without further analyzing the distribution characteristics of water in different pores, and without clearly distinguishing the specific forms and types of pore water.
Existing research indicates that initial preparation conditions and wetting-drying processes significantly influence the hydraulic and mechanical behavior of soil. However, systematic studies on how pore water distribution characteristics affect changes in soil macro-hydraulic and mechanical behavior are still lacking. Therefore, this paper employed NMR technology to systematically investigate the migration and redistribution process of pore water in soil. Considering the close relationship between soil suction and wetting-drying processes, suction testing methods were simultaneously employed to obtain the soil-water characteristic curve (SWCC). On this basis, pore water was classified into adsorbed water, intra-aggregate pore water, and inter-aggregate pore water. The distribution characteristics of these three pore water types during soil compaction, saturation, and drying processes were systematically analyzed, with a focus on discussing the patterns of their content variation with compaction degree and initial water content. Finally, two methods based on NMR test results were proposed for predicting the SWCC over a wide suction range.
Experimental Information:
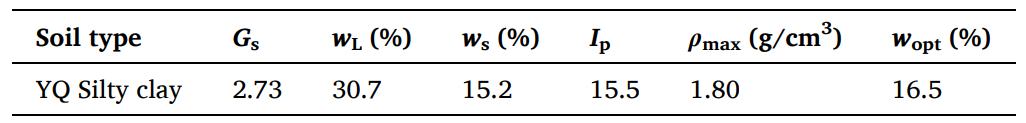
The test material was silty clay sourced from the Yanqing District in Beijing, referred to as Yanqing silty clay. Its basic physical properties are presented in Table 1.
Table 1 Basic Physical Properties of Yanqing Silty Clay
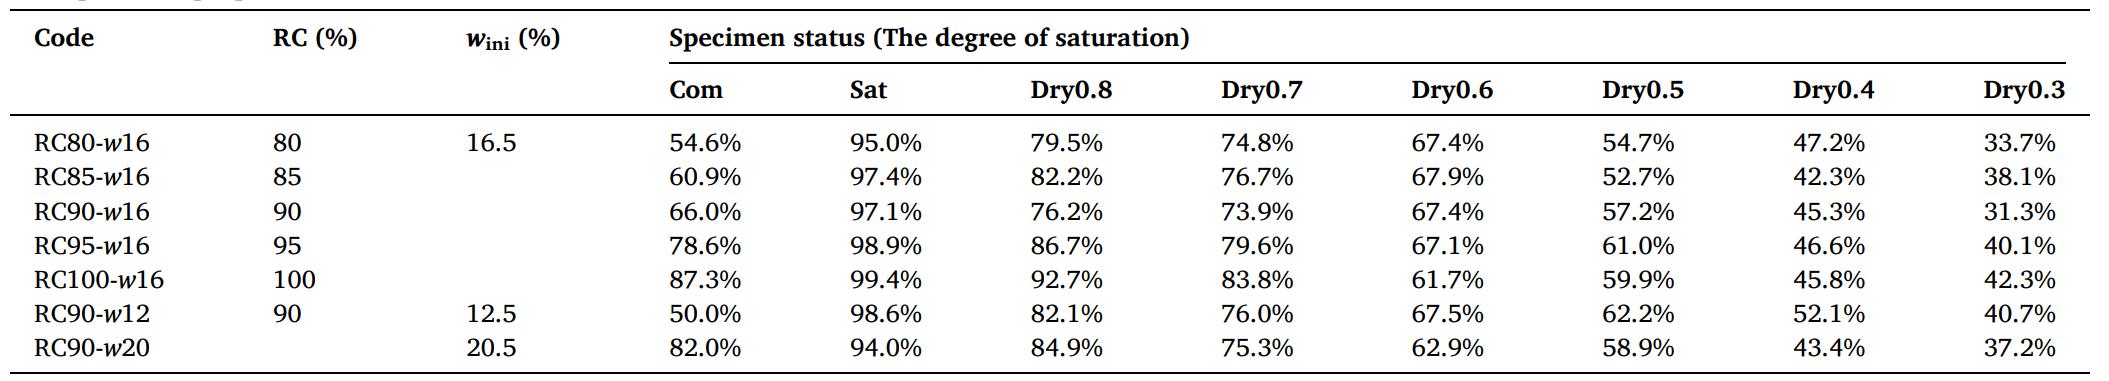
First, the soil material was oven-dried at 105 °C, and the fine-grained soil was sieved through a 2 mm diameter screen. The dried soil material was then placed in a sealed bag and cooled for later use. Next, based on the set initial preparation conditions, the masses of dry soil and water were calculated, and moistened soil material was prepared. Subsequently, a compaction mold was used to compact the moistened soil material into the center of a cutting ring to prepare compacted specimens. The compacted specimens were saturated using the vacuum saturation method. Saturated specimens were subjected to natural air-drying in a constant temperature and humidity environment to obtain unsaturated specimens with different gravimetric water contents. The saturation levels of the prepared specimens are shown in Table 2. To eliminate the interference of iron elements on the NMR signal, a polytetrafluoroethylene (PTFE) cutting ring with an inner diameter of 45 mm, outer diameter of 51 mm, and height of 20 mm was used instead of the conventional stainless steel cutting ring.
Table 2 Specimen Preparation Scheme
Due to the wide range of suction variation in fine-grained soils, a combined approach involving the pressure plate method, the contact filter paper method, and the WP4C dew point potentiometer was employed to obtain the soil-water characteristic curve, as illustrated in Figure 1.
To overcome the influence of the instrument’s inherent magnetic field inhomogeneity, NMR typically employs the CPMG pulse sequence to apply radio frequency pulses. Using the CPMG sequence yields a curve of the NMR signal decay over time, known as the CPMG curve. By performing a Fourier transform on the CPMG curve, the T2 distribution curve can be obtained. The area under the peaks of the T2 distribution curve (the total accumulated NMR signal, dimensionless) represents the water content corresponding to that specific T2 time range, thereby allowing the derivation of pore water content information within the soil.
This experiment utilized a low-field nuclear magnetic resonance analyzer manufactured by Niumag Corporation (China), model MesoMR23-060H-I. The instrument has a permanent magnetic field strength of 0.5 T (Tesla). To ensure the uniformity and stability of the main magnetic field, the magnet temperature was constantly maintained at 32 ± 0.01 °C, and the probe coil diameter was 60 mm. During the test, saturated specimens and unsaturated specimens cured using the contact filter paper method were placed in the NMR analyzer to measure their T2 distribution curves, as depicted in Figure 1. Since fine-grained soil undergoes volume shrinkage during drying, the specimen volume was measured using the liquid volume displacement method after the test to subsequently calculate the specimen’s void ratio.
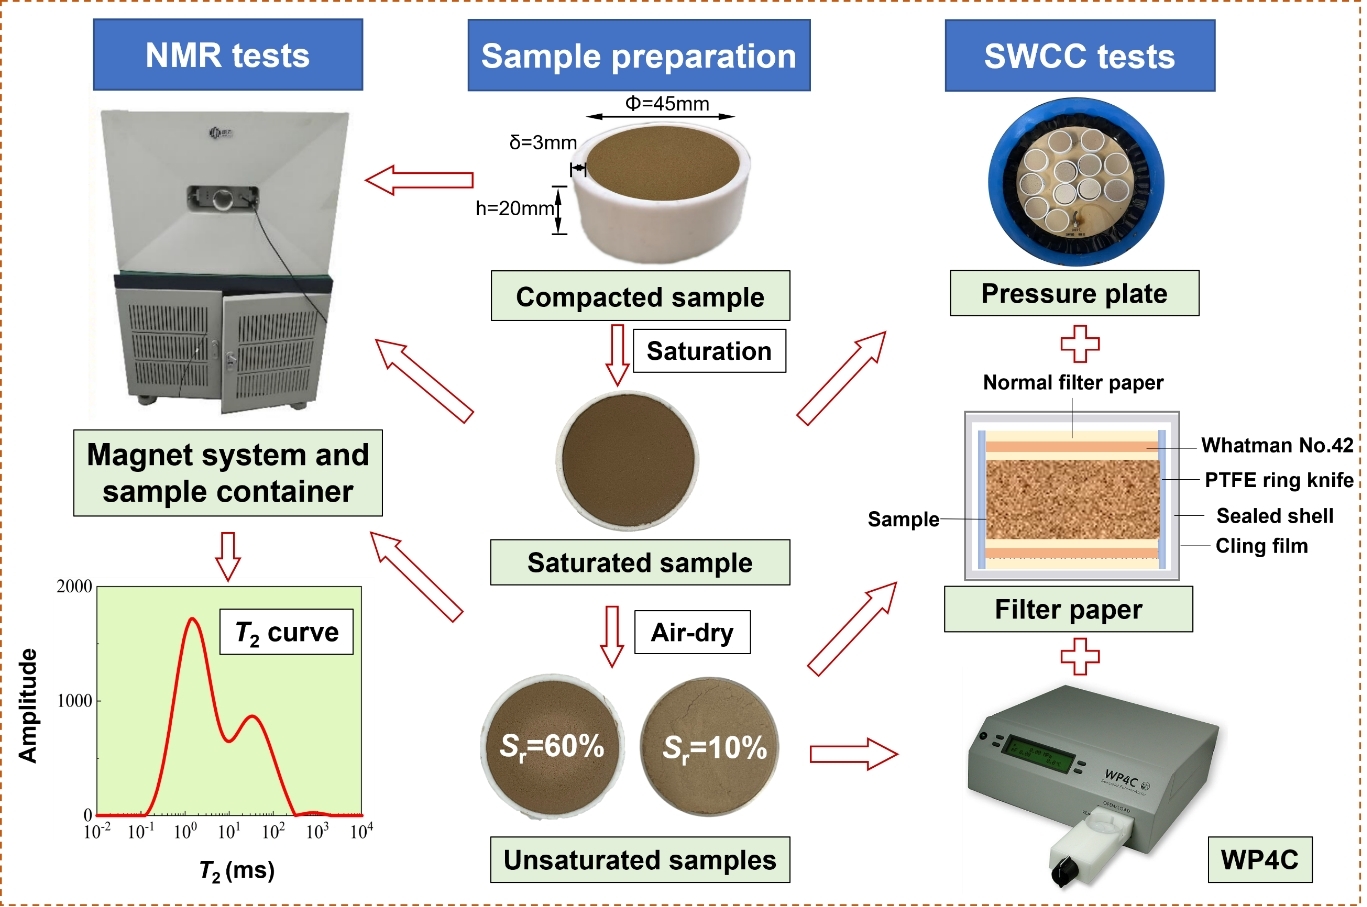
Figure 1 Schematic Diagram of the NMR-Water Retention Characteristic Test Procedure
Data Processing:
Figure 2(a) shows the T2 spectrum of a saturated specimen with a compaction degree of 80% and an initial water content of 16.5%. The abscissa represents the T2 relaxation time, and the ordinate represents the NMR signal amplitude. The area under the T2 distribution curve corresponds to the water content within the respective T2 time range. However, because the T2 time cannot quantitatively reflect pore size, and the NMR signal amplitude lacks a definite physical unit, using these two physical quantities to quantitatively characterize pore size and pore water content can lead to ambiguities in physical concepts. Therefore, it is necessary to convert these two physical quantities, i.e., transform T2 time into pore radius and NMR signal amplitude into commonly used water content.
The conversion between T2 time and pore radius r requires determining the pore water shape coefficient Cr for the soil:
![]() (1)
(1)
where Cr is the pore water shape coefficient, μm/ms.
NMR and Mercury Intrusion Porosimetry (MIP) tests were conducted on saturated soil to obtain two cumulative pore volume distribution curves. Through Excel Solver optimization, the Cr value for Yanqing silty clay was determined to be approximately 0.11 μm/ms. Substituting this value into formula (1) allows for the conversion of T2 time into pore radius r.
Using formula (2), the pore water volume for a given pore diameter can be calculated, thereby establishing a relationship with the signal amplitude:
 (2)
(2)
where Ai is the NMR signal amplitude corresponding to a specific T2 time; mw is the mass of pore water in the specimen, g; ms is the total mass of the wet soil specimen, g; md is the mass of the dry soil specimen, g; ρw is the density of water, taken as 1.0 g/cm³.
To better compare the pore water content of specimens with different compaction degrees, the normalized pore water volume, i.e., the pore water volume per gram of dry soil, was calculated using formula (3):
 (3)
(3)
where Vn is the normalized pore water volume, mL/g, a value equivalent to the gravimetric water content.
Using formulas (1) and (3), the NMR T2 spectrum (Figure 2(a)) can be converted into a pore water distribution curve (Figure 2(b)). It should be noted that since NMR technology detects hydrogen nuclei in the specimen, the pore water distribution curve of a saturated specimen is essentially the pore size distribution curve.
In Figure 2(b), the dominant pore radius (rdom) refers to the pore radius corresponding to the maximum pore water volume, associated with the main peak; the secondary pore radius (rs) refers to the pore radius corresponding to the second peak value, associated with the secondary peak; the maximum water-holding pore radius (rmax) refers to the largest pore radius on the pore water distribution curve where the pore water volume is non-zero.
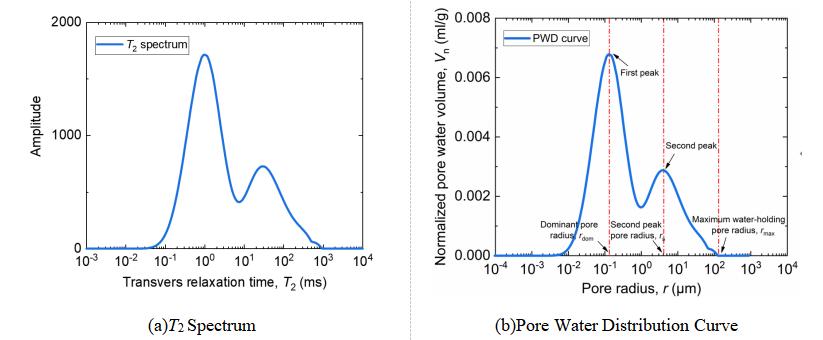
Figure 2 Conversion of T2 Spectrum to Pore Water Distribution Curve
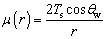
2 Conceptual Model of Pore Water Distribution
Specimens prepared by static compaction typically exhibit two types of pores: inter-aggregate pores and intra-aggregate pores. The size of inter-aggregate pores is generally larger than that of intra-aggregate pores, as illustrated in Figures 3(a) and (b).
On the surface of clay particles, molecular polarity leads to the formation of an electric double layer. The electric double layer consists of the permanent negative charge on the clay mineral surface and counterions in the surrounding solution, including the Stern layer (inner layer) and the diffuse layer (outer layer), as shown in Figure 3(c). In the Stern layer, several layers of water molecules are tightly adsorbed onto the clay particle surface, forming a very thin film of water called adsorbed water. In the diffuse layer, counterions are not only influenced by electrical forces but also tend to diffuse into the external solution. The water in the diffuse layer can be classified under intra-aggregate pore water.
In the Stern layer, the soil matric potential is primarily controlled by van der Waals forces, which can be quantified using formula (4):
 (4)
(4)
where μ(h) is the soil matric potential, J/m³; AH is the Hamaker constant, typically taken as -6 × 10⁻²⁰ J; h is the thickness of the adsorbed water film, nm. The adsorbed water film on the surface of silty clay particles is assumed to consist of three layers of water molecules, with each layer having a thickness of approximately 0.3 nm. Therefore, the thickness of the water film adsorbed on the soil particle surface is about 1.0 nm. Substituting h = 1.0 nm into formula (4) yields a soil matric potential of approximately 3183 J/m³.
In the unsaturated state, the relationship between the pore radius r where adsorbed water resides and the matric potential μ(r) can be described by the generalized Young-Laplace equation:
 (5)
(5)
where Ts is the surface tension, equal to 72.75 mN/m under the test environment condition of 20 °C; θw is the solid-liquid contact angle, typically taken as 0° for simplicity.
Substituting the matric potential μ(r) = 3183 J/m³ into formula (5) yields a calculated pore radius r of approximately 0.05 μm. This indicates that adsorbed water resides in pores with radii less than 0.05 μm.
Based on the above research findings, pore water in silty clay can be divided into three categories: inter-aggregate pore water (residing in pores with radii > 1.0 μm), intra-aggregate pore water (residing in pores with radii between 0.05 μm and 1.0 μm), and adsorbed water (residing in pores with radii < 0.05 μm). The delineation of these three pore water types in the pore water distribution curve of a saturated specimen is shown in Figure 3(d).
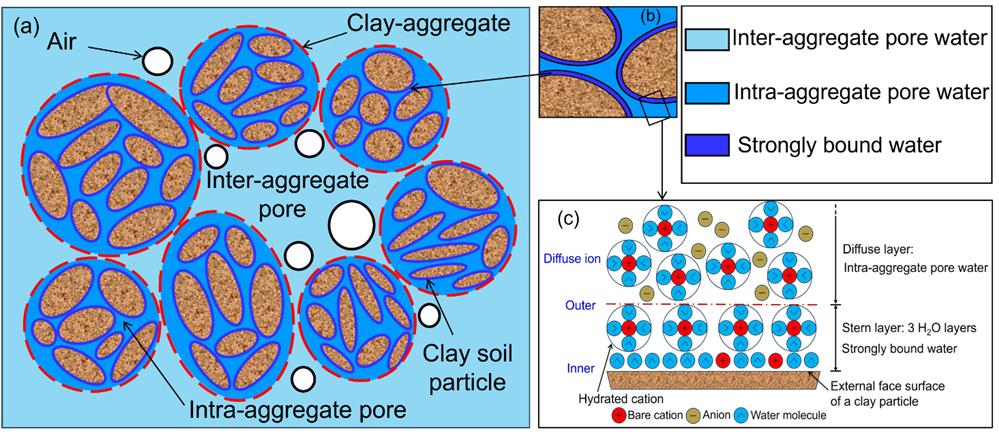
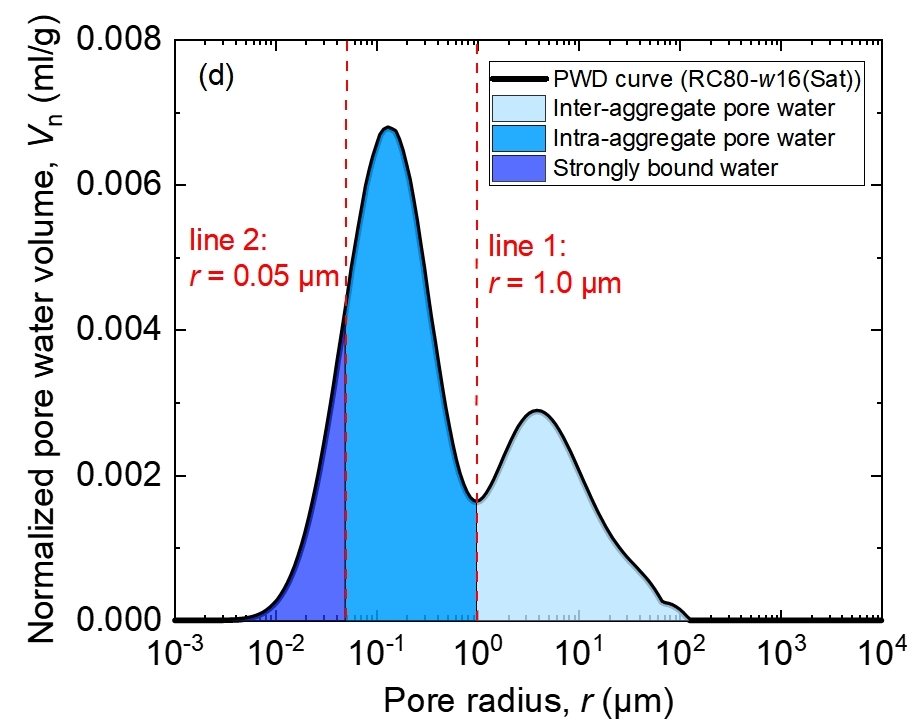
Figure 3 Conceptual Sketch of the Pore Water Distribution Model
Experimental Results Analysis and Discussion:
1 Evolution of Pore Water Distribution in Soil during Compaction, Saturation, and Drying Processes
1.1 Pore Water Distribution Curves of Unsaturated Compacted Specimens
Figure 4(a) shows the pore water distribution curves for unsaturated compacted specimens prepared at optimum water content but with different compaction degrees. It can be observed from the figure that pore water in unsaturated compacted specimens is primarily stored in pores with radii ranging from 0.005 μm to 0.35 μm. The pore water types are adsorbed water and intra-aggregate pore water, while inter-aggregate pores (pore radius > 1.0 μm) are dry. This indicates that compacting the specimen at optimum water content is insufficient for inter-aggregate pores to imbibe water, as illustrated in Figure 4(b). Furthermore, because the ordinate uses normalized pore water volume (pore water volume per gram of dry soil), the pore water distribution curves for specimens under different compaction degrees almost overlap. This suggests that the compaction stress applied in this study is insufficient to alter the morphology of the pore water distribution curve for unsaturated compacted specimens.
Figure 4(c) presents the pore water distribution curves for unsaturated compacted specimens with the same compaction degree but different initial water contents. From the pore water distribution perspective, as the initial water content increases, the curve segment corresponding to pore radii between 0.05 μm and 1.0 μm shifts upwards and to the right, while the curve segment for pore radii less than 0.05 μm remains unchanged. This indicates that the adsorbed water in different unsaturated compacted specimens has reached saturation; an increase in initial water content does not alter the adsorbed water content. However, the intra-aggregate pore water content increases with increasing initial water content (the main peak value increases). The surface photographs of unsaturated compacted specimens at different initial water contents shown in the figure reveal that the surface of specimens with initial water content higher than the optimum exhibits numerous clay aggregates and appears uneven. Moreover, for unsaturated compacted specimens with different initial water contents, their inter-aggregate pores remain dry. This suggests that for unsaturated compacted specimens prepared by static compaction, their inter-aggregate pores cannot imbibe water; these pores require saturation to become water-filled.
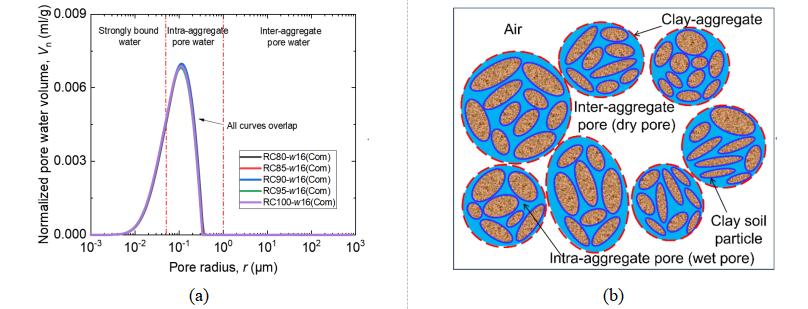
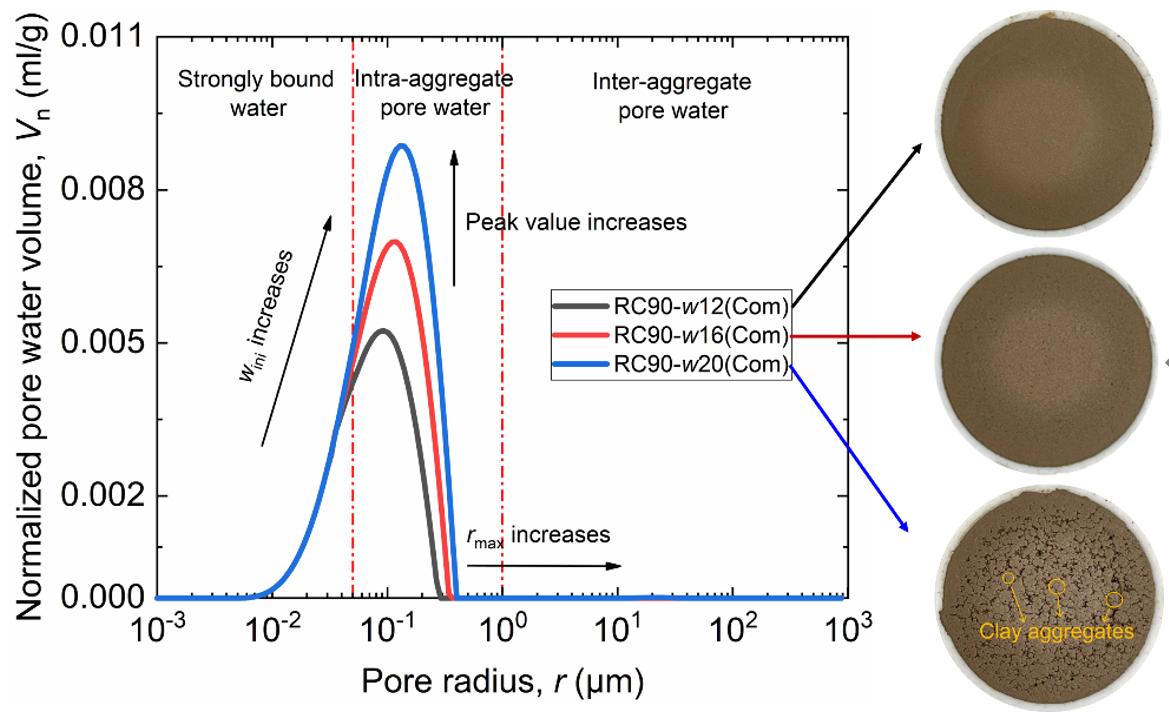
Figure 4 Pore Water Distribution in Unsaturated Compacted Specimens
1.2 Pore Water Distribution Curves of Saturated Compacted Specimens
1.2.1 Effect of Compaction Degree
Since all pores in saturated compacted specimens are water-filled, the pore water distribution curve obtained by NMR can characterize the soil’s pore size distribution. Figure 5 shows the pore water distribution curves for saturated compacted specimens prepared at optimum water content but with different compaction degrees. The pore water distributions for saturated compacted specimens under different compaction degrees all exhibit distinct bimodal characteristics, with the main peak pore radius around 0.13 μm and the secondary peak pore radius around 3.0 μm. When the compaction degrees are 100%, 95%, 90%, 85%, and 80%, the corresponding maximum water-holding pore radii are 9.4 μm, 12.0 μm, 23.0 μm, 37.4 μm, and 116.0 μm, respectively. As the compaction degree decreases, the maximum water-holding pore radius continuously increases. Regarding pore water distribution, the adsorbed water content is unaffected by changes in compaction degree, indicating that adsorbed water is tightly bound to clay particle surfaces and not influenced by external forces. In contrast, both intra-aggregate and inter-aggregate pore water contents (corresponding to the main and secondary peaks, respectively) increase with decreasing compaction degree, causing the pore water distribution curve to shift upward.
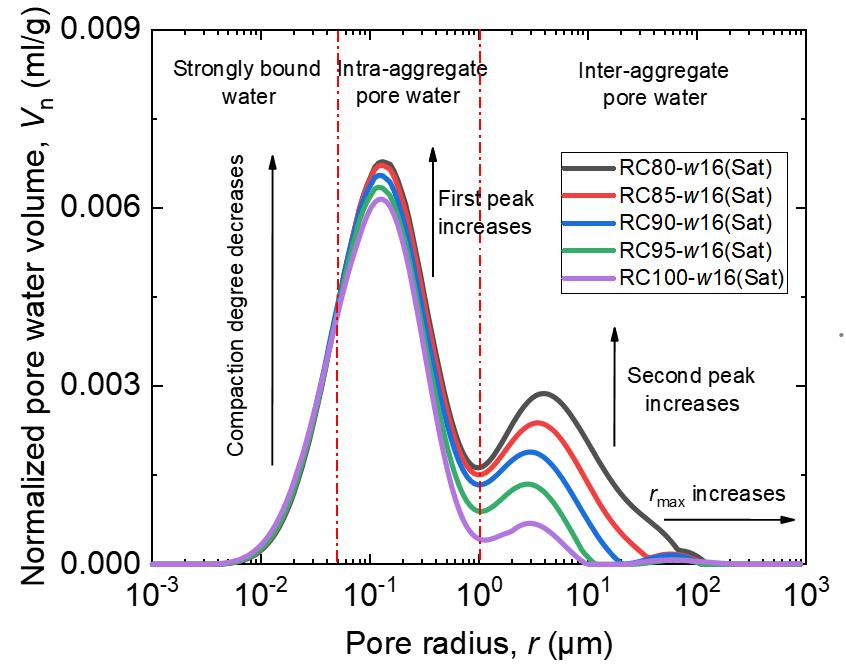
Figure 5 Pore Water Distribution of Saturated Specimens under Different Compaction Degrees
1.2.2 Effect of Initial Water Content
Figure 6 displays the pore water distribution curves for saturated compacted specimens with the same compaction degree but different initial water contents. As the initial water content increases, the adsorbed water content remains constant, while the dominant intra-aggregate pore water content increases significantly. Regarding characteristic pore radii, with increasing initial water content, the secondary peak pore radius and the maximum water-holding pore radius continuously increase, whereas the dominant pore radius remains unchanged. The morphology of the pore water distribution curve gradually evolves from unimodal to bimodal as the initial water content increases.
The surface photographs of saturated compacted specimens at different initial water contents shown in Figure 6 indicate that specimens with lower initial water content have a more uniform surface compared to those with higher initial water content. This is because at lower initial water contents, clay particles have not yet aggregated significantly to form prominent clay aggregates. As the initial water content increases, clay particles gradually aggregate, resulting in a bimodal pore water distribution. When the initial water content exceeds the soil’s plastic limit and approaches the liquid limit, the number of clay aggregates increases rapidly, leading to the appearance of distinct micro-cracks between aggregates and causing the specimen surface to become uneven.
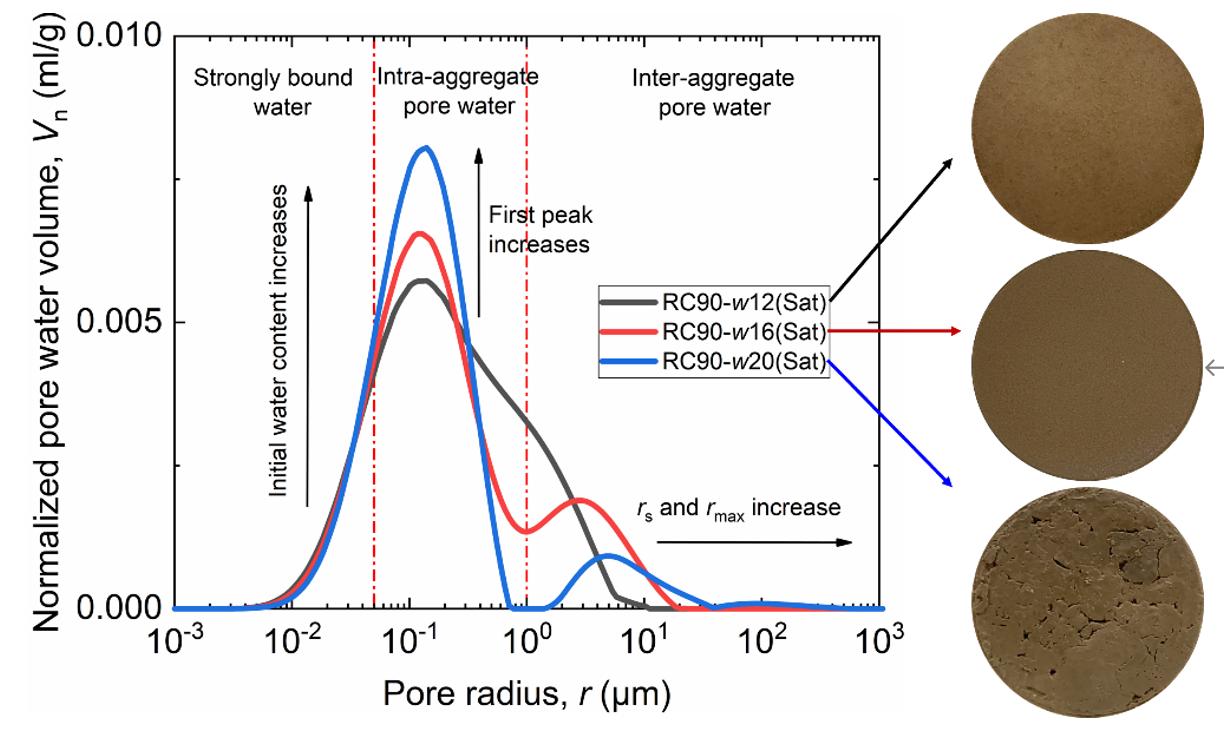
Figure 6 Pore Water Distribution of Saturated Specimens under Different Initial Water Contents
1.3 Evolution of Pore Water Distribution in Soil during Drying
The evolution of pore water distribution during soil drying can be discussed in two stages: In the first stage, as shown in Figure 7(a), the inter-aggregate pore water content (secondary peak) decreases rapidly, while the main peak intra-aggregate pore water content increases. This increase in the main peak pore water content may be related to the redistribution of pore water during the initial drying stage. Specifically, during initial drying, gas gradually enters the soil pores. The water-air menisci form first in the inter-aggregate pores. Inter-aggregate pore water is progressively replaced by gas, leading to a discontinuous distribution state of inter-aggregate pore water and altering the geometrical configuration of the pore water. This portion of water in large pores, now in a discontinuous state, might be detected by the NMR equipment as water residing in smaller pores. Consequently, the main peak pore water content exhibits an increasing phenomenon. In the second stage, as shown in Figure 7(b), with decreasing saturation, the area under the pore water distribution curve gradually diminishes. At this point, inter-aggregate pore water is completely drained. The water being expelled is primarily intra-aggregate pore water, while the adsorbed water content remains essentially constant. Furthermore, when the saturation decreases to 33.7%, the pore water distribution curve shifts to the left. This is due to the volume shrinkage of the silty clay specimen during drying, which causes a gradual reduction in the soil’s pore size.
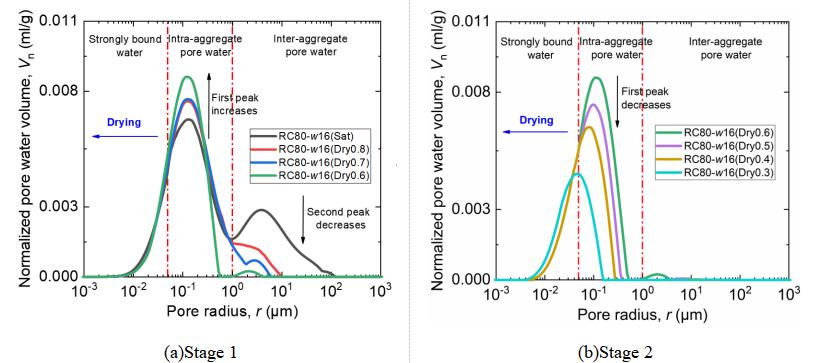
Figure 7 Evolution of Pore Water Distribution in Soil during Drying
2 Prediction of Soil-Water Characteristic Curve Based on Cumulative Pore Water Distribution Curve
Visualizing soil pores as a bundle of cylindrical tubes with different diameters, the volume of pore water stored in pores of different sizes varies. The pore water volume per gram of dry soil is defined as the pore water distribution function f(r). The term f(r)dr represents the pore water volume within the pore size range[r, r+dr]. Assuming interconnected pores, the differential relationship between the gravimetric water content w and the pore water distribution function can be expressed by formula (6):
 (6)
(6)
Integrating formula (6) yields the relationship between the pore water distribution function and the gravimetric water content:
 (7)
(7)
According to capillary tube theory, during soil drying, as matric suction increases sequentially to ψ1、ψ2、ψ3 … ψn(ψ1<ψ2<ψ3< … <ψn), pore water corresponding to pore radiir1、r2、r3…rn(r1>r2>r3>…>rn) is expelled sequentially. The relationship between matric suction ψ and pore radius r satisfies the Young-Laplace equation:
 (8)
(8)
Substituting formula (1) into formula (8):
 (9)
(9)
Substituting formula (1) into formula (7):
 (10)
(10)
Substituting formula (9) into formula (10) establishes a relationship between the soil-water characteristic curve and the cumulative pore water distribution curve:
 (11)
(11)
Based on the soil’s cumulative pore water distribution curve, two methods for predicting the soil-water characteristic curve are proposed:
(1) The first method does not consider volume shrinkage during soil drying, i.e., it assumes the pore structure remains unchanged and only considers pore water distribution. Under this assumption, the soil-water characteristic curve can be predicted using the cumulative pore water distribution curve of the saturated compacted specimen. This method is called the Saturated Soil Cumulative Curve Method.
(2) The second method considers volume shrinkage and pore water redistribution during soil drying. When the suction reaches a given suction value (ψi), all pore water in pores larger than T2i is drained, and the drained pores undergo drying shrinkage. After pores undergo shrinkage deformation, the remaining pore water in the soil redistributes, which is reflected in the cumulative pore water distribution curve of the unsaturated specimen corresponding to suction ψi. In other words, during the drying process, the envelope of the cumulative pore water distribution curves of various unsaturated specimens represents the actual soil-water characteristic curve. This method is called the Unsaturated Soil Envelope Method.
Based on measured soil-water characteristic curves of silty clay under different initial conditions, the predictive performance of the Saturated Soil Cumulative Curve Method and the Unsaturated Soil Envelope Method was compared. The normalized Sum of Squared Errors (SSE) was used to evaluate prediction accuracy, as shown in Figure 8. The comparison results indicate that both methods can reasonably predict the soil-water characteristic curves of silty clay under different initial conditions, with the Unsaturated Soil Envelope Method exhibiting higher prediction accuracy.
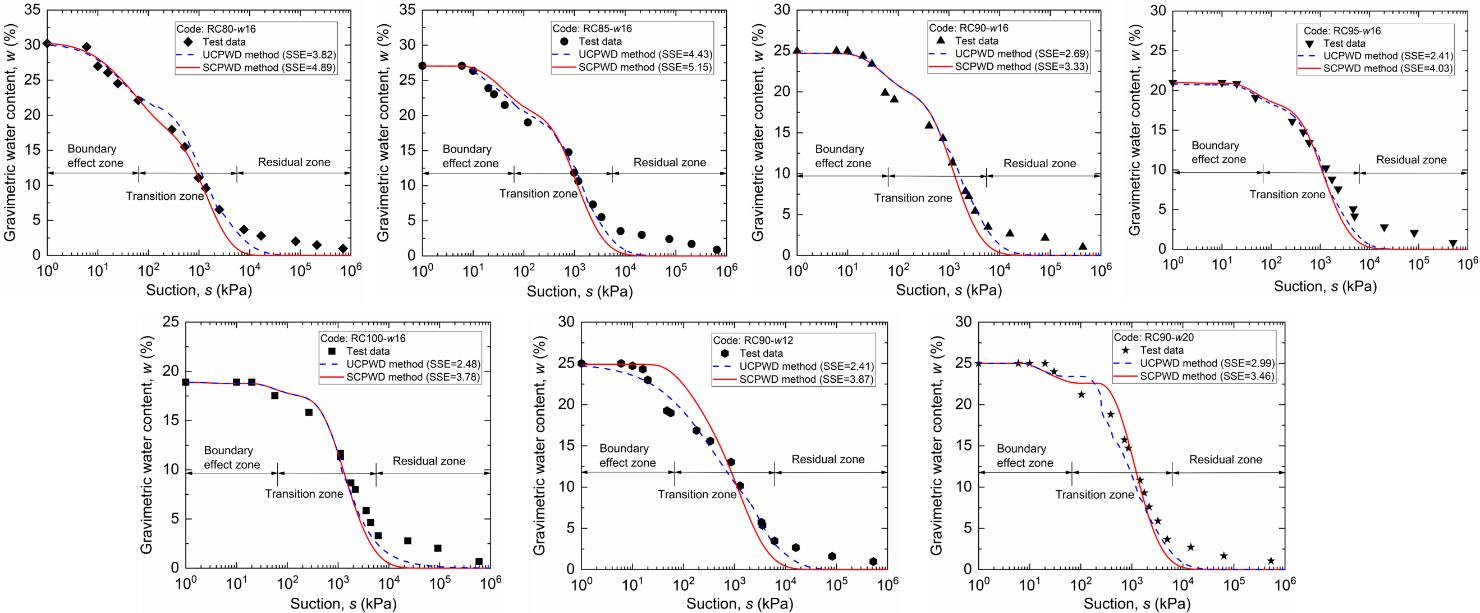
Figure 8 Prediction of Soil-Water Characteristic Curve Based on NMR Cumulative Pore Water Distribution Curves
Conclusions:
This chapter primarily investigated the evolution laws of pore water distribution in unsaturated soil using Nuclear Magnetic Resonance (NMR) technology. Combined with suction measurement results, the intrinsic relationship between the soil-water characteristic curve (SWCC) and the cumulative pore water distribution curve was explored. The main conclusions are as follows:
(1) A conceptual model for pore water distribution was proposed. Pore water in compacted silty clay can be categorized into three types: adsorbed water, intra-aggregate pore water, and inter-aggregate pore water, which are stored in pores with radii less than 0.05 μm, radii between 0.05 μm and 1.0 μm, and radii greater than 1.0 μm, respectively.
(2) For unsaturated compacted specimens, the pore water distribution curve does not vary with compaction degree, indicating that the compaction stress applied is insufficient to alter the morphology of the pore water distribution curve in compacted specimens. An increase in initial water content promotes the formation of clay aggregates, leading to an increase in the maximum water-holding pore radius and intra-aggregate pore water content. For saturated compacted specimens, intra-aggregate and inter-aggregate pore water contents increase as the compaction degree decreases, but the adsorbed water content remains constant.
(3) During soil drying, inter-aggregate pore water is rapidly expelled. The main peak intra-aggregate pore water content first increases and then decreases, while the adsorbed water content remains constant. Due to the presence of clay particles, the soil undergoes volume shrinkage during drying, causing the pore water distribution curve to shift towards smaller pore sizes.
(4) Based on the cumulative pore water distribution curves obtained from NMR tests, the Saturated Soil Cumulative Curve Method and the Unsaturated Soil Envelope Method were proposed for predicting the soil-water characteristic curve over a wide suction range. The results demonstrate that both methods can reasonably predict the SWCC of silty clay under different initial conditions, with the Unsaturated Soil Envelope Method providing higher prediction accuracy.
Recommended Equipment:
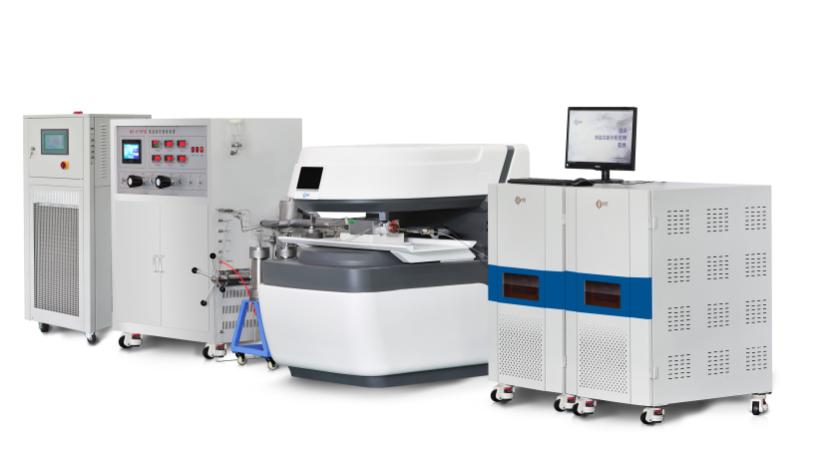
Large Aperture Nuclear Magnetic Resonance Imaging Analyzer
References
[1]Zhao, Y. X., Wu, L. Z., Li, X*. (2024). NMR-based pore water distribution characteristics of silty clay during the soil compaction, saturation, and drying processes. Journal of Hydrology, 636, 131240.
 Scan QR Code
 Scan QR Code
Phone: 400-060-3233
After-sales: 400-060-3233


Back to Top