
To measure the relaxivity of gadolinium-based MRI contrast agents and acquire T1-weighted images of contrast-agent samples.
2.1 Materials
Five contrast-agent samples prepared at graded concentrations.
2.2 Instruments
NM21 MRI relaxometry & imaging analyser (Niumag), 0.5 T field strength.
2.3 Methods
T1 relaxation measurement: Using the NMR analysis software, acquire signals with an inversion-recovery (IR) sequence. Fit the recovery curve with the inversion algorithm to obtain the corresponding T1 relaxation time.
T1-weighted imaging: Acquire T1-weighted images of the samples using a multi-slice spin-echo (MSE) imaging sequence.
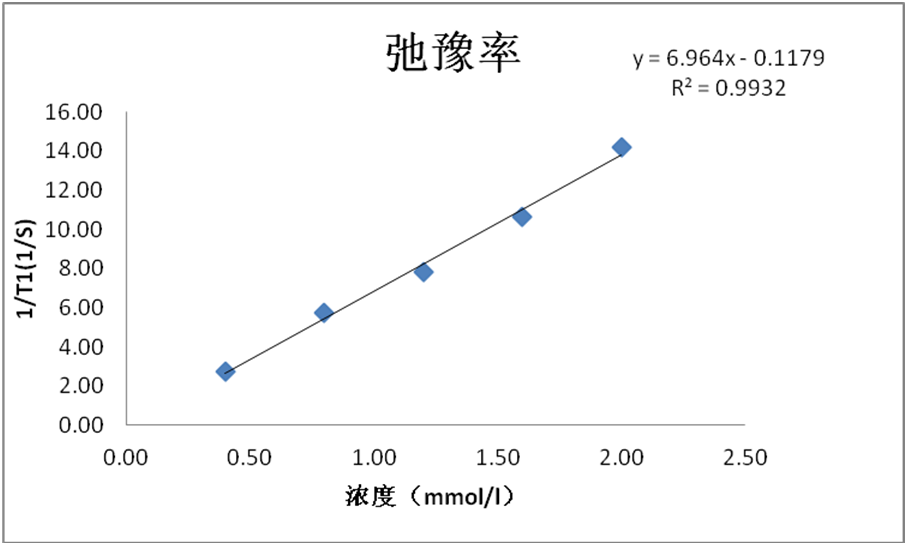
3.1 Relaxation time and relaxivity
With the IR sequence, longitudinal relaxation times are measured by recording recovery time t and the corresponding amplitude M(t). Fitting the curve of t–M(t) with the mono-exponential model M(t) = M(0) (1 − 2e−t/T1) yields T1.
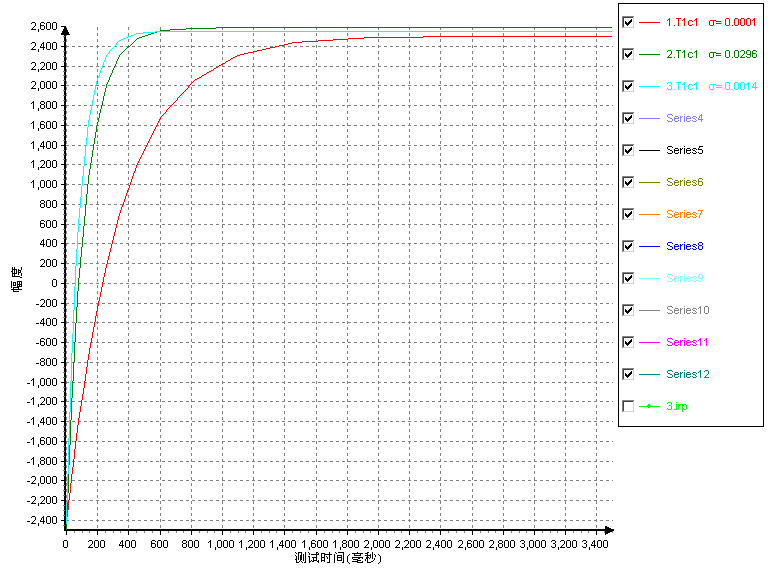
The decay curves show that higher sample concentrations produce faster signal recovery/decay and thus shorter T1; conversely, lower concentrations decay more slowly and exhibit longer T1.
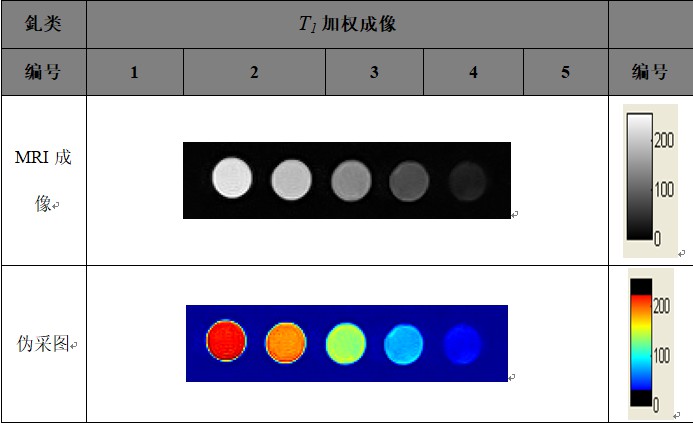
3.2 MRI imaging
Cross-sectional images of the samples were acquired to generate T1-weighted images.
 Scan QR Code
 Scan QR Code
Phone: 400-060-3233
After-sales: 400-060-3233


Back to Top