
Magnetic resonance imaging (MRI) is widely used in clinical practice due to its non-invasive nature, speed, high spatial resolution, and excellent tissue contrast. In oncology in particular, MRI exploits differences in the physical properties of diseased and normal tissues to generate structural and functional images, making it indispensable for early diagnosis of primary tumours and metastases. Tumourigenesis is a complex, long-term, multi-factorial process involving multiple steps and gene mutations. Most malignancies arise from a single clone and display uncontrolled growth. Clinically, many patients present at mid-to-late stages, missing the optimal therapeutic window—one reason for persistently high cancer mortality. Despite its strengths, MRI’s relatively low intrinsic sensitivity limits early tumour detection because early lesions and normal tissues often differ only subtly in physical parameters (e.g., T1 and T2), yielding insufficient image contrast. To overcome this, MRI contrast agents are used to enhance the contrast between tumour and normal tissues, facilitating earlier diagnosis.
The hydrogen (^1H) signal underpins MRI of most tissues. Contrast agents themselves do not generate signal; rather, they alter the relaxation times of tissue hydrogen nuclei, thereby creating contrast with surrounding tissues. MRI signal intensity depends on physical and chemical parameters such as proton density, spin–lattice relaxation time T1, and spin–spin relaxation time T2. T1 and T2 govern image contrast. Because proton density varies little across soft tissues, T1- and T2-weighted imaging are routinely used in diagnosis. The effect of a contrast agent depends on its local concentration and on the proton density and dynamics within the tissue.
MRI contrast agents are magnetic materials that interact magnetically with hydrogen nuclei. They modulate signal primarily by affecting T1 and/or T2. Accordingly, agents are broadly classified as T1 agents (which increase signal on T1-weighted images) and T2 agents (which decrease signal on T2-weighted images). Choice of agent depends on tissue characteristics. T1 shortening requires direct interaction between water protons and the magnetic moiety of the agent—i.e., water protons must approach the paramagnetic centres closely to enhance relaxation. For example, liposome-encapsulated Gd–DTPA yields weaker T1 enhancement than free Gd–DTPA at the same concentration because the liposomal shell limits access of external water to Gd–DTPA. T2 shortening is a longer-range effect: local field inhomogeneities induced by T2 agents accelerate dephasing. Encapsulating a T2 agent within liposomes can further enhance T2 relaxation due to aggregation-driven increases in local field perturbations.
The relationships between tissue T1, T2 and contrast-agent concentration are as follows:
R1 and R2 are the longitudinal and transverse relaxation rates contributed by the agent, describing its influence on tissue T1 and T2, and [c] is the concentration of uniformly distributed agent. Equations (1) and (2) show simple linear relationships between 1/T1 or 1/T2 and agent concentration. R1 and R2 depend on agent structure: for T1 agents, proximity of water molecules to the paramagnetic centres is critical; for T2 agents, the effect scales with the concentration and magnetic moment of the particulate species.
In 1971, Damadian observed that T1 and T2 relaxation times of water protons in tumour tissue are longer than in normal tissue. In 1978, Mallard, Hutchison, Lauterbur and colleagues obtained the first human head, chest, and abdominal images using 0.04–0.085 T NMR systems. Since then, MRI—non-ionising, non-destructive, reagent-free, and capable of interrogating processes from molecular to organ scale in vivo—has advanced rapidly and become a mainstay of clinical diagnostics worldwide.
The diagnostic principle of MRI is to exploit differences in the resonance signals of water protons across tissues under an external magnetic field. Signal strength reflects tissue water content and proton relaxation times, enabling early detection of necrosis, local ischaemia, and malignant transformation (e.g., tumours).
Images were acquired on a small-animal MRI system. Shown are T1-weighted axial and coronal images with the following parameters: FOV = 100 mm × 100 mm, TR = 400 ms, TE = 19 ms, slice thickness 3.5 mm, gap 1 mm, averages 16, k-space matrix 192 × 256. Post-contrast, the rat heart and liver appear brighter, then gradually darken with time as the agent is metabolised.
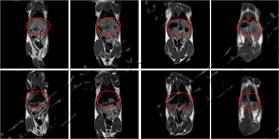
Rat MRI coronal images before and after contrast
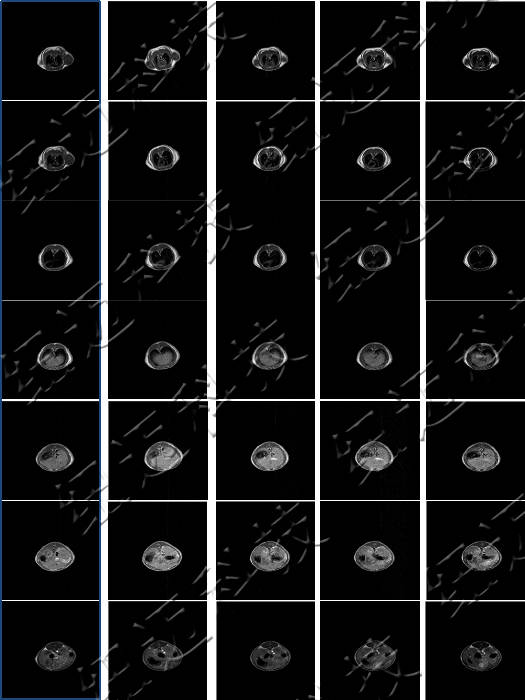
Axial MRI showing in vivo metabolism of contrast agent in a rat
 Scan QR Code
 Scan QR Code
Phone: 400-060-3233
After-sales: 400-060-3233


Back to Top