NIUMAG
Porosity of Concrete Measurement – Low Field NMR
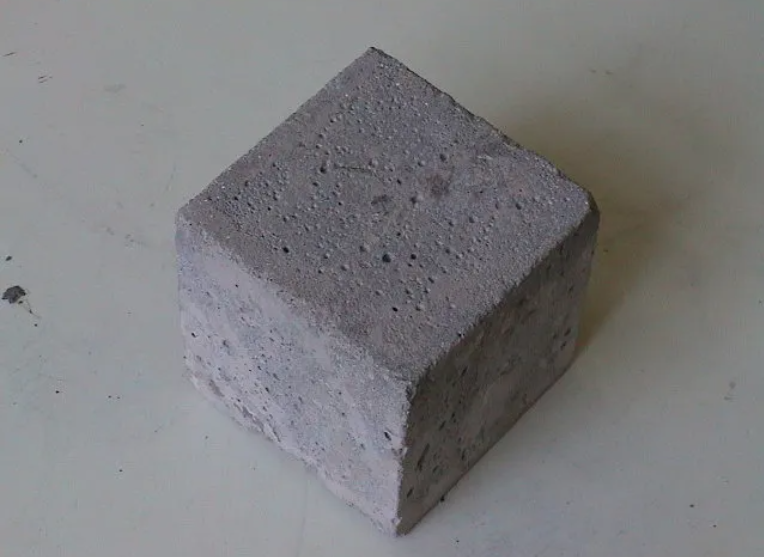
In the construction industry, concrete is a widely used functional material. Solid concrete has a large number of pores. Those pore states are different and the different states will result differences in its properties. Accurate testing of concrete porosity is a prerequisite for in-depth study of concrete properties.
Commonly used measurement methods for porosity of concrete
Weighing method, mercury intrusion method, electron microscope scanning method, X-ray method, etc.
Today’s sharing is about the application of concrete porosity NMR testing. The testing instrument we used is NIUMAG Benchtop NMR.
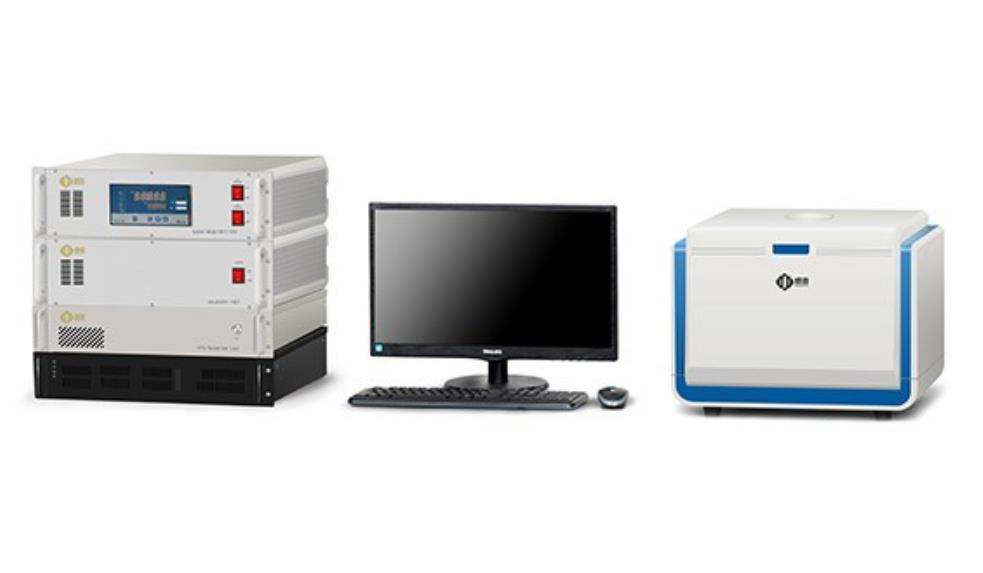
Porosity NMR analyzer MicroMR12-025V
-
PorosityTest
Applicable samples:
Various cores, tight sandstones, cuttings, coal rocks, cement, etc.
-
Porosity TestMethod and Principle
The fluids in pores have three different relaxation mechanisms:
1) Free relaxation, 2) Surface relaxation, 3) Diffusion relaxation.
It can be expressed as:
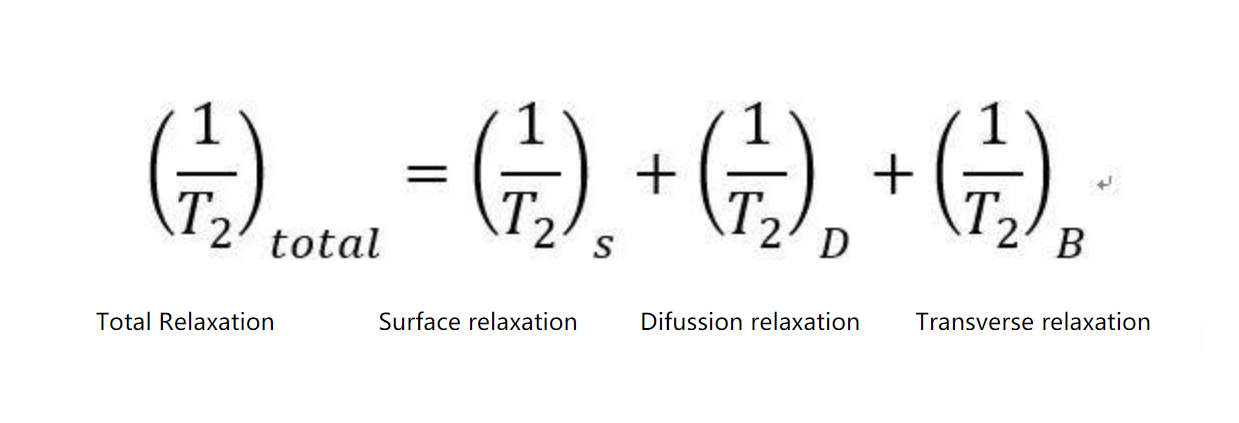
T2 total: Transverse relaxation time of pore fluid, it is collected by CPMG sequence;
T2B: Intrinsic properties of hydrogen-containing fluids, the unit is in the order of ‘s’, generally negligible;
T2S: Transverse relaxation time caused by surface relaxation;
T2D: Transverse relaxation time of pore fluid. It was caused by diffusion under magnetic field gradient which can be ignored under uniform magnetic field;
The T2 relaxation time reflects chemical environment of hydrogen protons inside the sample, and is related to the binding force and freedom degree of those hydrogen protons. The binding degree of the hydrogen protons is inseparable with the internal structure of the sample.
Removing the effects of transverse relaxation and diffusion, the T2 distribution is related to the pore size. In porous media, the larger the pore size is, the longer the relaxation time of the water in the pore is; the smaller the pore size is, the shorter the relaxation time is, that means the apex is related to pore size. The area of the apex is related to the quantity of the corresponding pore. When a short TE is taken and the pores contain only water, the surface relaxation plays a major role. It means T2 is directly proportional to the pore size:

ρ2 is the relaxation ratio of the rock surface, which can be taken a reference of relevant papers and literature to select the corresponding value of the sample, or you can calibrate through the mercury injection curve. S/V is the ratio of the pore surface area to the fluid volume.
When the pores are calculated as spheres, T2 is proportional to the pore radius ‘r’, so the graph of T2 distribution reflects the distribution of pore sizes for real.
-
Porosity Test Results
The first step is to saturate the sample with water, then place the sample in the NMR special probe coil to measure the T2 spectrum via setting the appropriate NMR parameters.
By looking into the literature, it is determined that ρ2=50 µm/s of the sample in this experiment, so the T2 spectrum can be converted into a pore size distribution diagram.
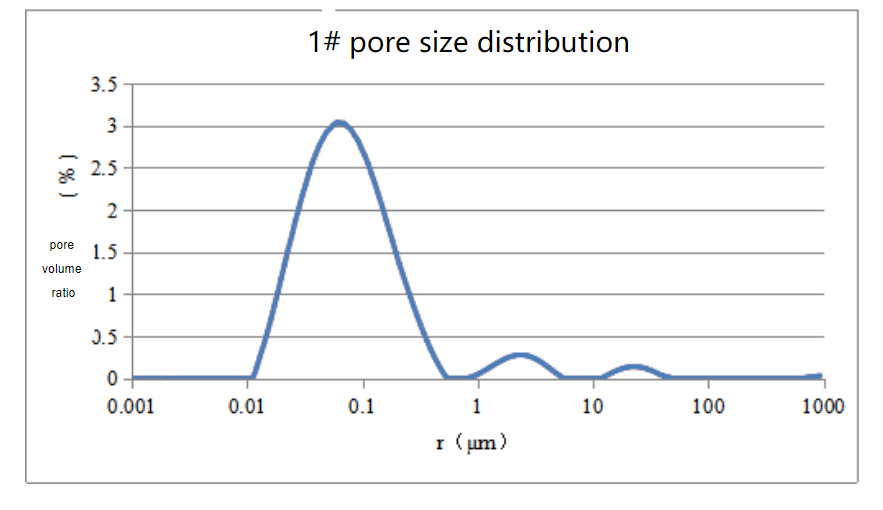
Sample 1# pore size distribution
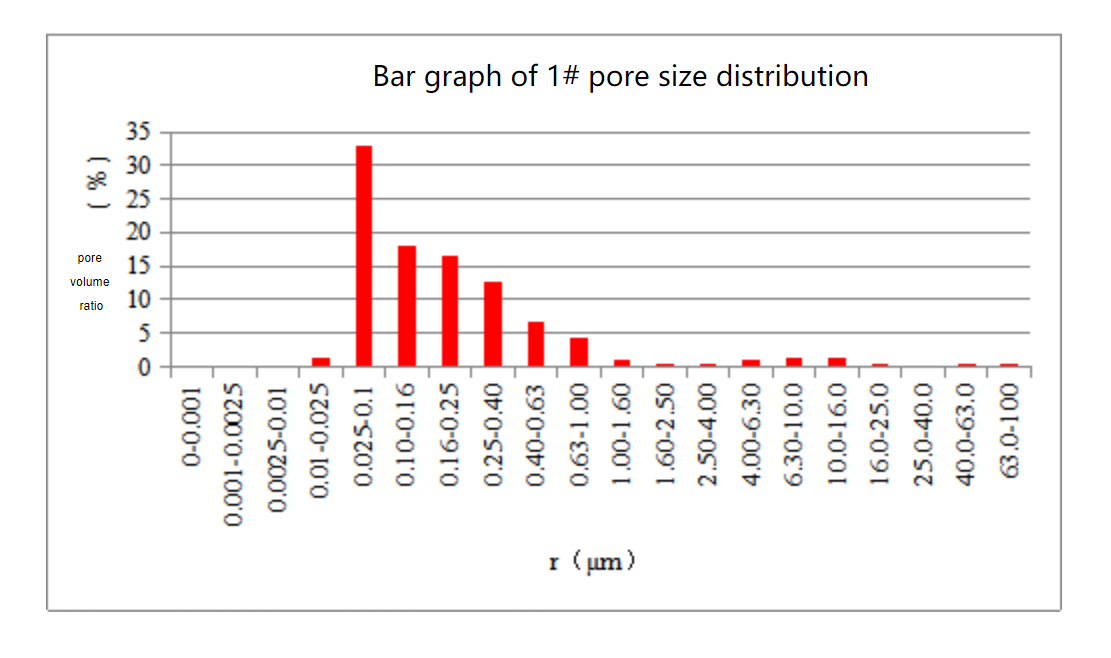
Bar graph of 1# pore size distribution
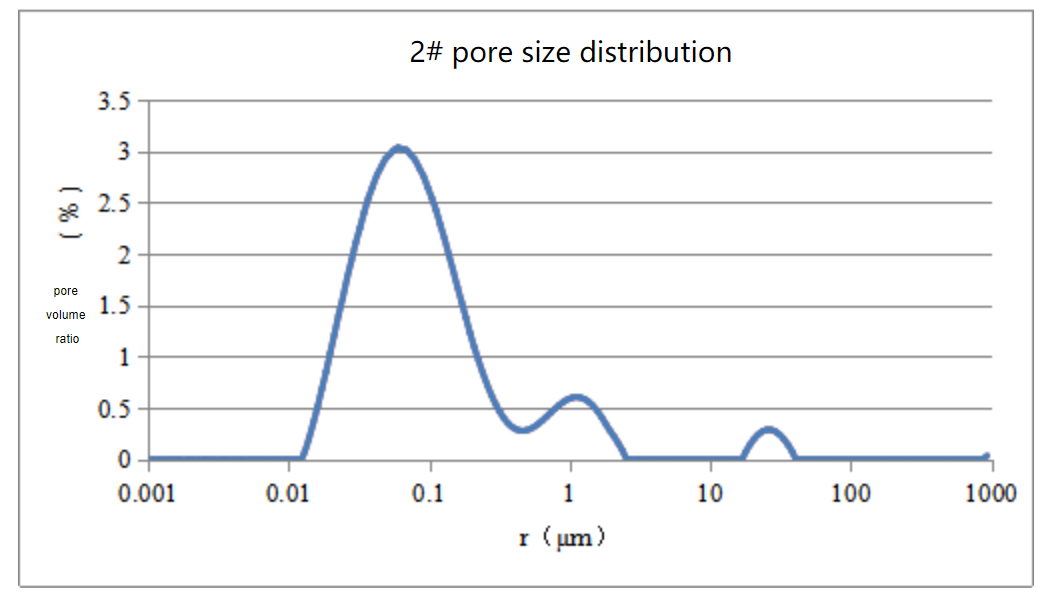
Sample 2# pore size distribution
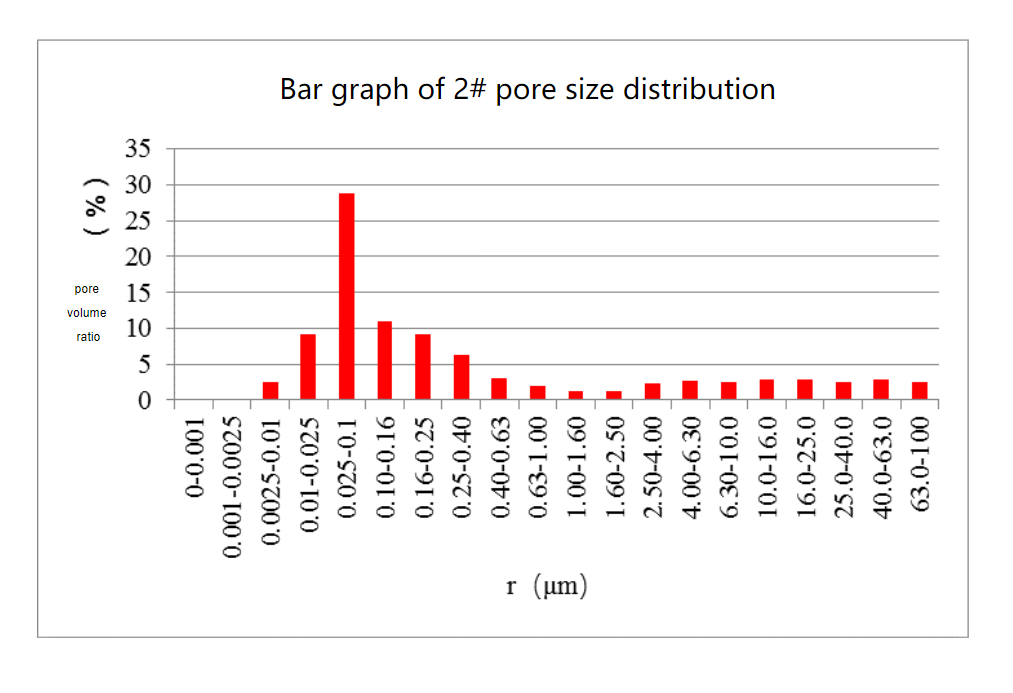
Bar graph of 2# pore size distribution
It can be seen from the above graphs, there are some differences in the pore structure of the two samples: the pore size distribution of 2# is wider, while the pore size of 1# is mainly small pores, and the proportion of large pores is relatively less.
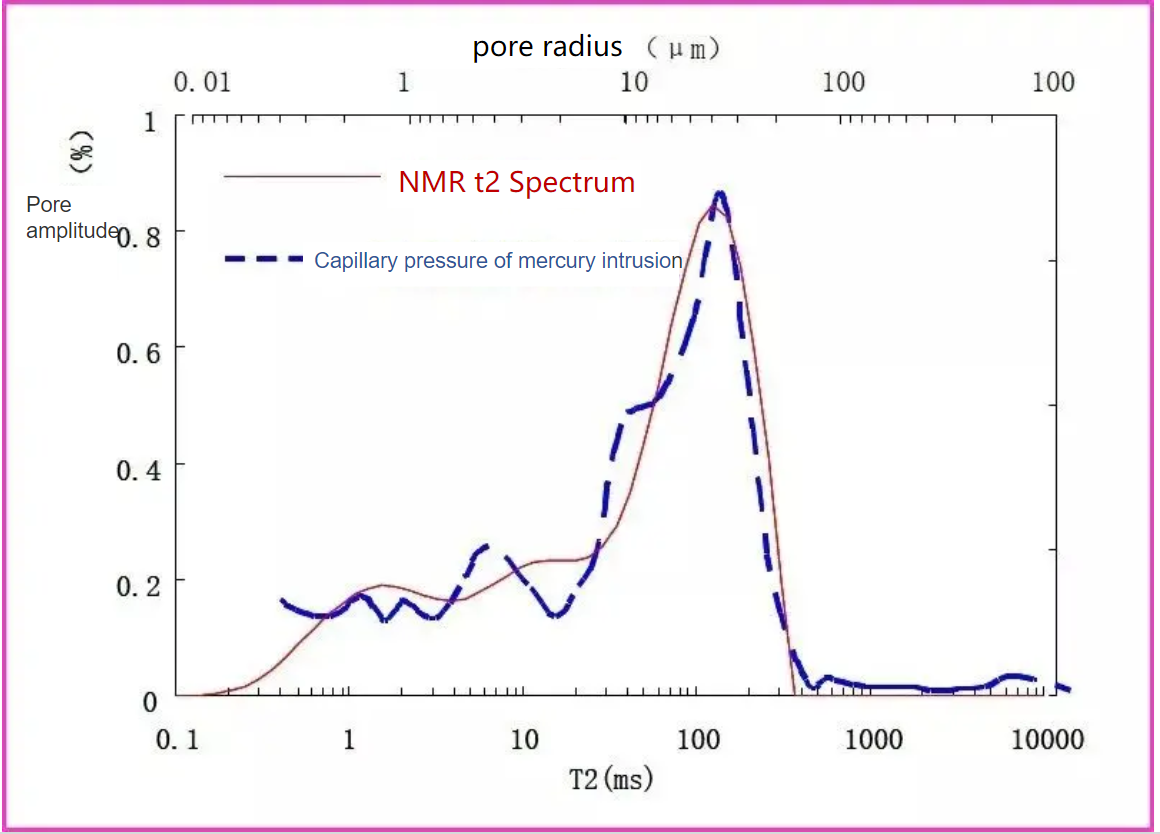
Comparison of NMR T2 Curve with Mercury Intrusion Curve
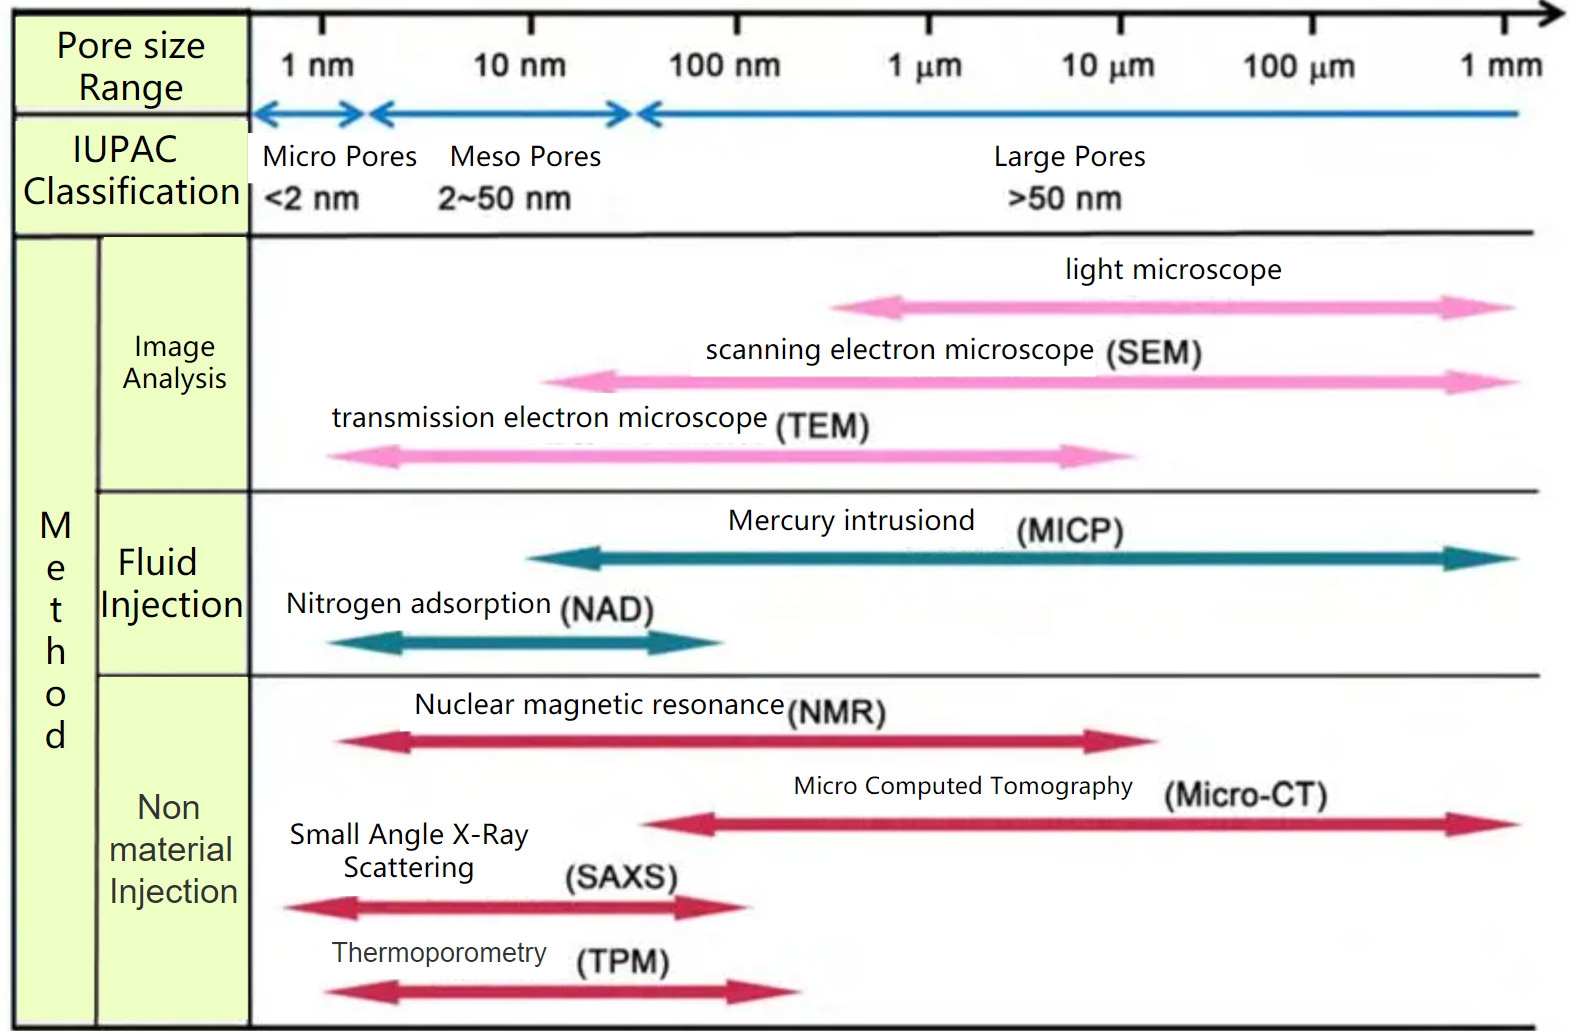
T2 relaxation curve displays the similar results to the capillary pressure curve. In contrast, the NMR method has the advantages of fast, high accuracy, high resolution, good repeatability, and easy operation. The pretreatment only needs to saturate the sample with water, and the distribution of the pore size range is wide for NMR testing, typically from 0.1 nm to 200μm.
Combined with NMR freeze-thaw method, we can detect pores in the range of 4 – 1400 nm. The advantages of the two methods are complementary, and the measurement range from micro pores, meso pores to macro pores is perfectly realized.